EGB Spreads ... using a RX-IK hedge to reduce credit exposure, with 3 trade examples
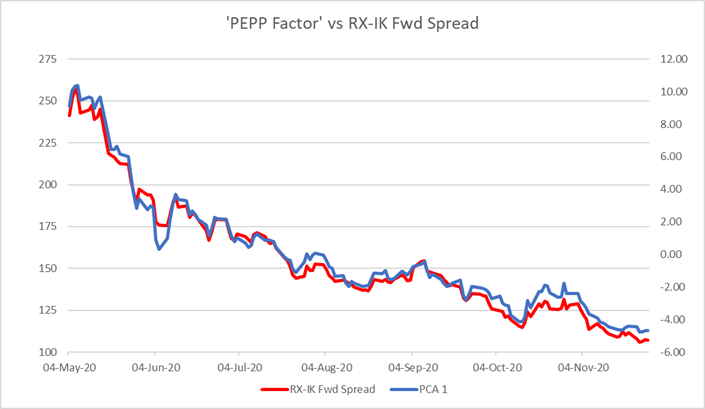
Bottom Line: The ECB's PEPP has been and continues to be the primary factor driving inter-country EGB spreads tighter. So I have set out to find a single market factor that can be used to hedge the effects of the programme on sovereign credit spreads in the Eurozone. My conclusion is that a large part of the variation in spreads can be hedged by a simple RX-IK contract hedge.
Trades:
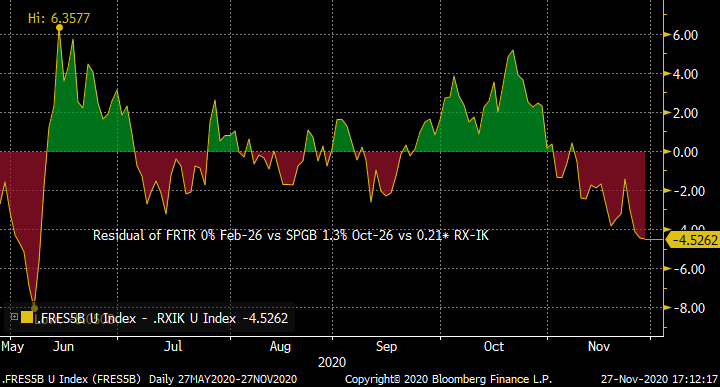
Buy OAT 0% Feb-26
Sell Bonos 1.3% Oct-26
with a hedge of 0.21% DV01 in RX-IK contracts (Buy IK)
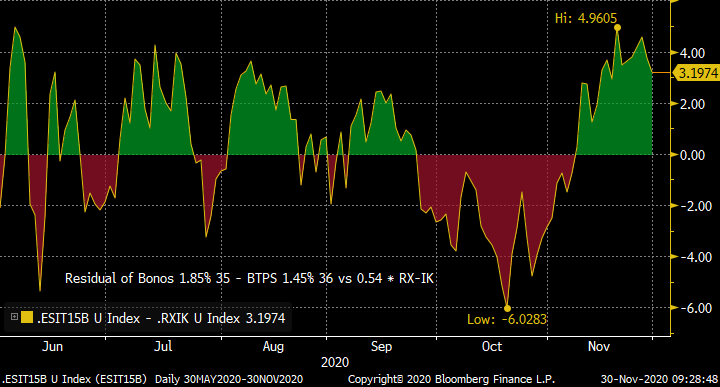
Buy Bonos 1.85% 35
Sell BTPS 1.45% 36
with a hedge of 0.45% DV01 in RX-IK contracts (Buy IK)
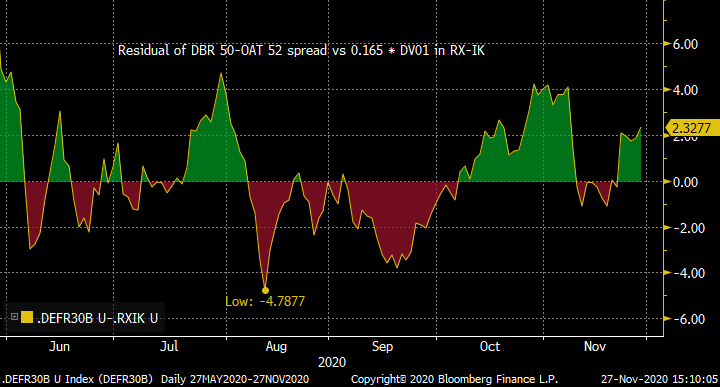
Sell Bund 0% Aug-50
Buy OAT 0.75% May-52
with a hedge of 0.17% DV01 in RX-IK contracts (Sell IK)
Rationale: It is apparent to even the most casual observer that inter-country EGB spreads have been well-correlated through the Covid crisis. This is not surprising as all countries are suffering economically, and the introduction of the PEPP has been a game-changer for spreads. Credit spreads have narrower relentlessly as the EU has embraced the concept of burden-sharing (not least through the massive expansion of EU issuance).
But which spreads, and at what tenors have tightened too much, and which not enough?
To attempt to answer this question, I have taken a reduced grid of 15 non-overlapping spreads (Germany-France, France-Spain and Spain-Italy) and tenors (5y,10,15y,20y & 30y) to extract a "PEPP factor" using PCA for the past seven months (ie after the PEPP initiative was introduced). As a starting point, the rate inputs are taken from the par-spline CMT rates for each country: this will give us a guide to the narrow/wide sectors without benchmark roll discontinuities.
Once I have extracted the PCA1 factor, I have scanned a wider set of over-lapping spreads (still using CMT rates). The spread with the highest correlation to the PCA1 factor over the analysis period is Germany-Italy 10y (R2 of 99% on level regression). This is perhaps not a shock, but the analysis does provide a statistical validation for our intuition. The happy by-product is that this is a spread which is easily reproducible in the futures market through the forward yield spread of the RX and IK contracts. This is how the PCA1 / PEPP Factor compares to the RX-IK forward spread.
It is also straightforward to scan this universe for the spreads that are the most dislocated from the prediction from the RX-IK spread:
|
5Y |
France |
Spain |
Italy |
|
Germany |
0.8 |
-1.2 |
-0.4 |
|
France |
|
-1.7 |
-0.7 |
|
Spain |
|
|
0.8 |
|
10Y |
France |
Spain |
Italy |
|
Germany |
0.3 |
-0.7 |
0.8 |
|
France |
|
-1.0 |
0.4 |
|
Spain |
|
|
1.1 |
|
15Y |
France |
Spain |
Italy |
|
Germany |
0.4 |
-0.5 |
1.1 |
|
France |
|
-0.9 |
0.7 |
|
Spain |
|
|
1.4 |
|
20Y |
France |
Spain |
Italy |
|
Germany |
0.6 |
0.0 |
0.4 |
|
France |
|
-0.5 |
-0.1 |
|
Spain |
|
|
0.3 |
|
30Y |
France |
Spain |
Italy |
|
Germany |
1.1 |
0.1 |
0.5 |
|
France |
|
-0.7 |
-0.3 |
|
Spain |
|
|
0.3 |
The colour-coding allows us identify some likely areas to look deeper:
- France-Spain 5y too narrow
- Spain-Italy 15y too wide
- Germany-France 30y too wide
So, let's look at a few examples of spreads that have been identified as out of line.
France-Spain 5y vs RX-IK
Here I'm using a slightly longer Bonos than the more recent SPGB 0% Jan-26 to get more history for the spread. The residual shows that Spain has richened over the past month to now look around 5bp too narrow when hedged with the RX-IK spread.
Spain-Italy 15 y vs RX-IK
15y Italy has been performing well vs France and Spain recently, but now makes 15y Spain look relatively cheap:
Germany-France 30y vs RX-IK
With a DV01 beta-weighting of 1:0.165 DBR-OAT: RX-IK, this is the residual of Germany-France 30y for the past 6 months, showing the spread to be around 2.5bp too wide currently. Long-end supply is coming in France next week, so we might look for the 4bp residual extreme to be reached. As my colleagues have noted, in May next year the OAT becomes eligible for PEPP and PSPP buying, which could give it a transitional boost.
Taking things a stage further, we can simply scan the universe of spreads for box trades with have a high absolute T-stat while maintaining a decent correlation between the spreads. The pattern is that France-Italy spreads are too narrow when compared to Spain-Italy, on a weighted basis.
|
Spread A |
Spread B |
R^2 |
Resid |
T-stat |
|
Spain-Italy 5Y |
France-Italy 5Y |
97% |
-6.0 |
-1.9 |
|
Spain-Italy 10Y |
France-Italy 5Y |
96% |
-6.6 |
-1.8 |
|
Spain-Italy 15Y |
France-Italy 5Y |
95% |
-8.4 |
-2.0 |
|
Spain-Italy 15Y |
France-Italy 10Y |
97% |
-5.4 |
-1.8 |
|
Spain-Italy 15Y |
France-Italy 20Y |
97% |
-5.8 |
-1.8 |
|
Spain-Italy 15Y |
France-Italy 30Y |
95% |
-6.4 |
-1.7 |
The point here is that while a four-bond cross-issuer trade can be tricky to execute, the RX-IK hedge can be used to leg the position. In principle you can construct a portfolio of such two-bond spreads with a net RX-IK hedge for the position.
I hope this is a starting point for discussing which spreads can offer value.
Any thoughts? Please let me know!
Best wishes
David
David Sansom
![]()
UK: 14-16 Dowgate Hill, London EC4R 2SU
US: 245 Park Ave, 39th Floor, NY, NY, 10167
Office: +44 (0) 203 143 4180
Mobile: +44 (0) 7976 204490
Email: david.sansom@astorridge.com
Web: www.AstorRidge.com
This marketing was prepared by David Sansom, a consultant with Astor Ridge. It is not appropriate to characterize this e-mail as independent investment research as referred to in MiFID and that it should be treated as a marketing communication even if it contains a trade recommendation. A history of marketing materials and research reports can be provided upon request in compliance with the European Commission's Market Abuse Regulation. Astor Ridge takes no proprietary trading risk, has no market making facilities, and has no position in any security we discuss in this e-mail. The views in this e-mail are those of the author(s) and are subject to change, and Astor Ridge has no obligation to update its opinions or the information in this publication. If this e-mail contains opinions or recommendations, those opinions or recommendations reflect solely and exclusively those of the author, and such opinions were prepared independently of any other interests, including those of Astor Ridge and/or its affiliates. This publication does not constitute personal investment advice or take into account the individual financial circumstances or objectives of the those who receive it. The securities discussed herein may not be suitable for all investors. Astor Ridge recommends that investors independently evaluate each issuer, security or instrument discussed herein, and consult any independent advisors they believe necessary. The value of, and income from, any investment may fluctuate from day to day as a result of changes in relevant economic markets (including changes in market liquidity). The information herein is not intended to predict actual results, which may differ substantially from those reflected. Past performance is not necessarily indicative of future results.
You should not use or disclose to any other person the contents of this e-mail or its attachments (if any), nor take copies. This e-mail is not a representation or warranty and is not intended nor should it be taken to create any legal relations, contractual or otherwise. This e-mail and any files transmitted with it are confidential, may be legally privileged, and are for the sole use of the intended recipient. Copyright in this e-mail and any accompanying document created by Astor Ridge LLP is owned by Astor Ridge LLP.
Astor Ridge LLP is regulated by the Financial Conduct Authority (FCA): Registration Number 579287
Astor Ridge LLP is Registered in England and Wales with Companies House: Registration Number OC372185
Astor Ridge NA LLP is a member of FINRA/SIPC: CRD Number 282626
Astor Ridge NA LLP is Registered in England and Wales with Companies House: Registration Number OC401796
Trade update: CAD 5y5y vs EUR + idea for SEK 1y2y vs EUR
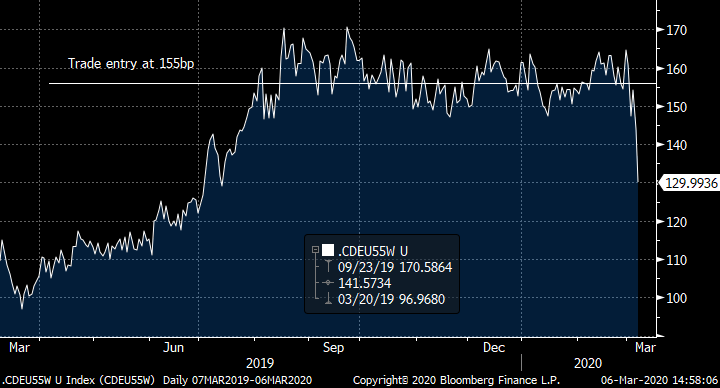
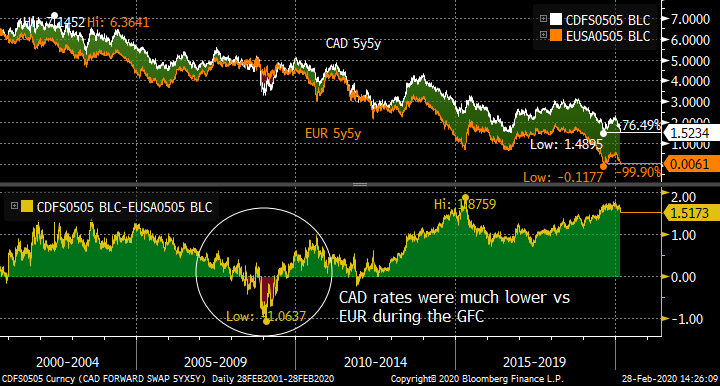
A week ago, I suggested CAD 5y5y vs EUR spread tighteners (on a PCA-weighted basis). The weighted spread at the time was 155bp, and has narrowed 25bp to 130bp today (chart). The markets are highly volatile, and the momentum is for this trade to narrow further, so I’d lighten up the position here but not close completely.
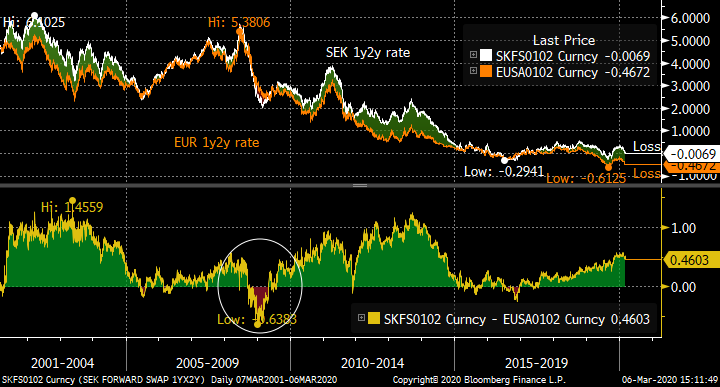
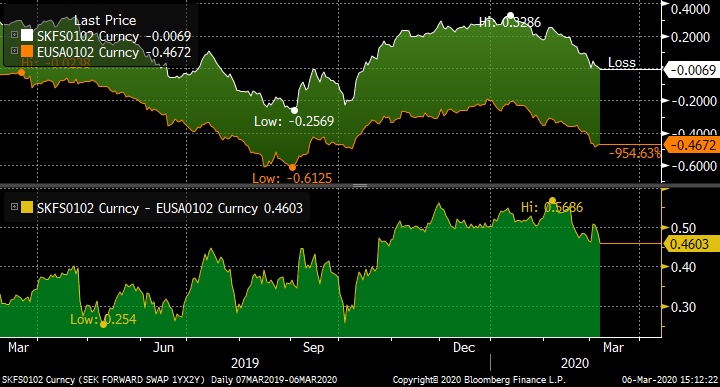
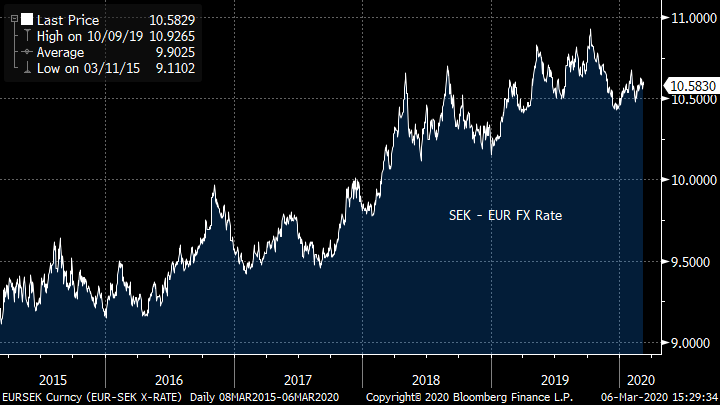
A home for the VaR released might be a similar idea in SEK vs EUR short rates. Receive SEK 1y2y rate (2y rate, 1y fwd) and pay EUR. The spread is currently at the top end of the range, and was much tighter during the global financial crisis of 2008/09.
The recent history shows this spread has started to compress, but has plenty of room to move further.
Riksbank vs ECB policy rates for the past 20 years. The Riksbank has, on paper at least, considerably more space to ease back to their previous level of accommodation.
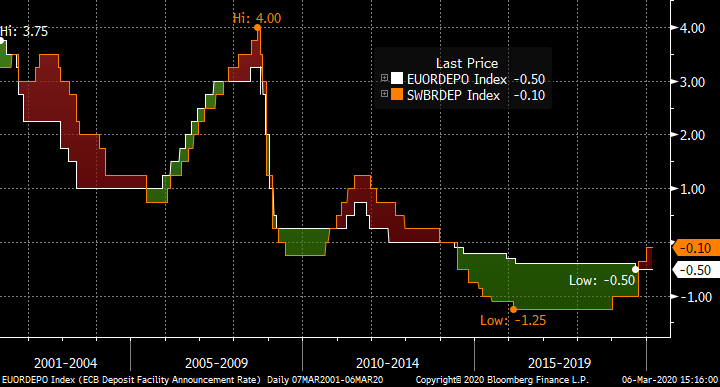
The SEK-EUR FX rate has been a concern of the Riksbank in past, which suggests that any ECB easing would be matched (if not exceeded) by the Swedes.
I realize it’s a volatile time, and liquidity can be a problem, but I’d be interested on your thoughts on this!
Best wishes
David
As a reminder, this is the recommendation from last Friday:
Bottom Line: In the event of a sustained global slowdown, Canadian rates have further to fall than EUR (not least since the Bank of Canada has more bullets left than the ECB), but currently the spread is at the wides. Hence this is a decent cross-market swap trade on its own merits, but puts you long the tail risk of a major correction due to a viral pandemic. Other cross-market spreads have already moved sharply towards their historical GFC extremes of 2008/09, but CAD-EUR 5y5y has yet to see a similar move.
Trade:
Recv CAD 300mm 5y5y swap
Pay EUR 225mm 5y5y swap
Target entry 155bp on the 1:1.28 weight
(Equivalent to USD 100k/bp of CAD 5y5y. DV01 weight 1:1.28)
Rolldown of approx. negative 5bp over the first year.
Rationale: The evolution of the coronavirus epidemic and its impact on the global economy is close to impossible to forecast. While cases at the epicentre of the outbreak appear at least to be plateau’ing, reported infection numbers further afield seem to be on an upward trajectory, as is the concern in both public and financial life. The fragile state of some developed economies is not a good starting place for a shock to supply or activity. In the rates space, it is common to look at 5y5y rates to assess dislocations between currencies, and the CAD 5y5y rate has been pulsing on cross-market heat maps.
I’ve run a PCA analysis of 5y5y rates for the last 20 years of data, and the two currencies’ 5y5y rates that stand out are EUR to the low side, and CAD to the high side (see table)
Residual vs PCA 1 for G10 5y5y rates:
|
EUR |
GBP |
USD |
JPY |
SEK |
NOK |
CHF |
AUD |
NZD |
CAD |
|
|
Residual bp |
-61.1 |
-22.3 |
53.8 |
-50.0 |
-37.1 |
30.2 |
5.1 |
-15.8 |
24.1 |
105.2 |
|
T-stat |
-1.46 |
-0.89 |
1.29 |
-1.28 |
-1.01 |
0.94 |
0.26 |
-0.32 |
0.43 |
2.26 |
So, even prior to the virus newsflow, my model was flagging up a receive CAD / pay EUR trade.
Using the PCA 1 weights (with an exponential beta) gives a relative weight of CAD:EUR 1:1.28. This is the past year’s relationship on that basis:
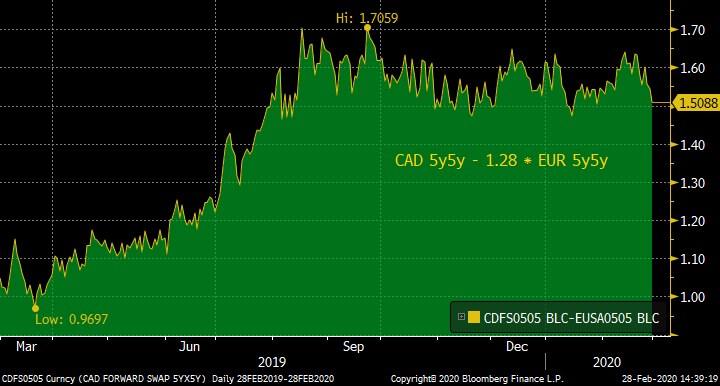
The spread has already started to move (though the volatility in the market makes exact levels unclear), but is still very much at the high end of the past year’s range. So this is not an unreasonable local RV trade, but the history during the global financial crisis suggests that if the coronavirus outbreak becomes pandemic and we re-approach the conditions of the global financial crisis of 08/09 this spread could collapse. Canada is an oil producer, Europe is a consumer so the effect of lower oil prices (on reduced Chinese/global demand) will have the opposite impact in each economy. In addition, Canada has room below to deliver accommodation in a way that Europe does not, having used up most if not all of its monetary ammunition.
Would love to have your feedback,
Best wishes,
David
David Sansom
![]()
UK: 14-16 Dowgate Hill, London EC4R 2SU
US: 245 Park Ave, 39th Floor, NY, NY, 10167
Office: +44 (0) 203 143 4180
Mobile: +44 (0) 7976 204490
Email: david.sansom@astorridge.com
Web: www.AstorRidge.com
This marketing was prepared by David Sansom, a consultant with Astor Ridge. It is not appropriate to characterize this e-mail as independent investment research as referred to in MiFID and that it should be treated as a marketing communication even if it contains a trade recommendation. A history of marketing materials and research reports can be provided upon request in compliance with the European Commission’s Market Abuse Regulation. Astor Ridge takes no proprietary trading risk, has no market making facilities, and has no position in any security we discuss in this e-mail. The views in this e-mail are those of the author(s) and are subject to change, and Astor Ridge has no obligation to update its opinions or the information in this publication. If this e-mail contains opinions or recommendations, those opinions or recommendations reflect solely and exclusively those of the author, and such opinions were prepared independently of any other interests, including those of Astor Ridge and/or its affiliates. This publication does not constitute personal investment advice or take into account the individual financial circumstances or objectives of the those who receive it. The securities discussed herein may not be suitable for all investors. Astor Ridge recommends that investors independently evaluate each issuer, security or instrument discussed herein, and consult any independent advisors they believe necessary. The value of, and income from, any investment may fluctuate from day to day as a result of changes in relevant economic markets (including changes in market liquidity). The information herein is not intended to predict actual results, which may differ substantially from those reflected. Past performance is not necessarily indicative of future results.
You should not use or disclose to any other person the contents of this e-mail or its attachments (if any), nor take copies. This e-mail is not a representation or warranty and is not intended nor should it be taken to create any legal relations, contractual or otherwise. This e-mail and any files transmitted with it are confidential, may be legally privileged, and are for the sole use of the intended recipient. Copyright in this e-mail and any accompanying document created by Astor Ridge LLP is owned by Astor Ridge LLP.
Astor Ridge LLP is regulated by the Financial Conduct Authority (FCA): Registration Number 579287
Astor Ridge LLP is Registered in England and Wales with Companies House: Registration Number OC372185
Astor Ridge NA LLP is a member of FINRA/SIPC: CRD Number 282626
Astor Ridge NA LLP is Registered in England and Wales with Companies House: Registration Number OC401796
Macro trade for a GFC re-run: Receive CAD 5y5y vs EUR
Bottom Line: In the event of a sustained global slowdown, Canadian rates have further to fall than EUR (not least since the Bank of Canada has more bullets left than the ECB), but currently the spread is at the wides. Hence this is a decent cross-market swap trade on its own merits, but puts you long the tail risk of a major correction due to a viral pandemic. Other cross-market spreads have already moved sharply towards their historical GFC extremes of 2008/09, but CAD-EUR 5y5y has yet to see a similar move.
Trade:
Recv CAD 300mm 5y5y swap
Pay EUR 225mm 5y5y swap
Target entry 155bp on the 1:1.28 weight
(Equivalent to USD 100k/bp of CAD 5y5y. DV01 weight 1:1.28)
Rolldown of approx. negative 5bp over the first year.
Rationale: The evolution of the coronavirus epidemic and its impact on the global economy is close to impossible to forecast. While cases at the epicentre of the outbreak appear at least to be plateau’ing, reported infection numbers further afield seem to be on an upward trajectory, as is the concern in both public and financial life. The fragile state of some developed economies is not a good starting place for a shock to supply or activity. In the rates space, it is common to look at 5y5y rates to assess dislocations between currencies, and the CAD 5y5y rate has been pulsing on cross-market heat maps.

I’ve run a PCA analysis of 5y5y rates for the last 20 years of data, and the two currencies’ 5y5y rates that stand out are EUR to the low side, and CAD to the high side (see table)
Residual vs PCA 1 for G10 5y5y rates:
|
EUR |
GBP |
USD |
JPY |
SEK |
NOK |
CHF |
AUD |
NZD |
CAD |
|
|
Residual bp |
-61.1 |
-22.3 |
53.8 |
-50.0 |
-37.1 |
30.2 |
5.1 |
-15.8 |
24.1 |
105.2 |
|
T-stat |
-1.46 |
-0.89 |
1.29 |
-1.28 |
-1.01 |
0.94 |
0.26 |
-0.32 |
0.43 |
2.26 |
So, even prior to the virus newsflow, my model was flagging up a receive CAD / pay EUR trade.
Using the PCA 1 weights (with an exponential beta) gives a relative weight of CAD:EUR 1:1.28. This is the past year’s relationship on that basis:

The spread has already started to move (though the volatility in the market makes exact levels unclear), but is still very much at the high end of the past year’s range. So this is not an unreasonable local RV trade, but the history during the global financial crisis suggests that if the coronavirus outbreak becomes pandemic and we re-approach the conditions of the global financial crisis of 08/09 this spread could collapse. Canada is an oil producer, Europe is a consumer so the effect of lower oil prices (on reduced Chinese/global demand) will have the opposite impact in each economy. In addition, Canada has room below to deliver accommodation in a way that Europe does not, having used up most if not all of its monetary ammunition.
Would love to have your feedback,
Best wishes,
David
David Sansom
![]()
UK: 14-16 Dowgate Hill, London EC4R 2SU
US: 245 Park Ave, 39th Floor, NY, NY, 10167
Office: +44 (0) 203 143 4180
Mobile: +44 (0) 7976 204490
Email: david.sansom@astorridge.com
Web: www.AstorRidge.com
This marketing was prepared by David Sansom, a consultant with Astor Ridge. It is not appropriate to characterize this e-mail as independent investment research as referred to in MiFID and that it should be treated as a marketing communication even if it contains a trade recommendation. A history of marketing materials and research reports can be provided upon request in compliance with the European Commission’s Market Abuse Regulation. Astor Ridge takes no proprietary trading risk, has no market making facilities, and has no position in any security we discuss in this e-mail. The views in this e-mail are those of the author(s) and are subject to change, and Astor Ridge has no obligation to update its opinions or the information in this publication. If this e-mail contains opinions or recommendations, those opinions or recommendations reflect solely and exclusively those of the author, and such opinions were prepared independently of any other interests, including those of Astor Ridge and/or its affiliates. This publication does not constitute personal investment advice or take into account the individual financial circumstances or objectives of the those who receive it. The securities discussed herein may not be suitable for all investors. Astor Ridge recommends that investors independently evaluate each issuer, security or instrument discussed herein, and consult any independent advisors they believe necessary. The value of, and income from, any investment may fluctuate from day to day as a result of changes in relevant economic markets (including changes in market liquidity). The information herein is not intended to predict actual results, which may differ substantially from those reflected. Past performance is not necessarily indicative of future results.
You should not use or disclose to any other person the contents of this e-mail or its attachments (if any), nor take copies. This e-mail is not a representation or warranty and is not intended nor should it be taken to create any legal relations, contractual or otherwise. This e-mail and any files transmitted with it are confidential, may be legally privileged, and are for the sole use of the intended recipient. Copyright in this e-mail and any accompanying document created by Astor Ridge LLP is owned by Astor Ridge LLP.
Astor Ridge LLP is regulated by the Financial Conduct Authority (FCA): Registration Number 579287
Astor Ridge LLP is Registered in England and Wales with Companies House: Registration Number OC372185
Astor Ridge NA LLP is a member of FINRA/SIPC: CRD Number 282626
Astor Ridge NA LLP is Registered in England and Wales with Companies House: Registration Number OC401796
GBP Macro trade: Buy 5-30 Floors, funding by OTM receivers on 2y.
Bottom Line: Commentators see the UK government smashing the chains off the austerity coffers as they attempt to fulfil their generous election spending plans. This shift to Keynesian infrastructure, research and other stimulative spending should push the MPC off centre-stage and into the wings. Our view is that increased Gilt supply will drive yields higher in the belly (5y to 10y) than at the short or long ends, and that this could send the 5-30 curve back towards the inverted pre-crisis levels. At the same time, an equivocal MPC will find it hard to cut rates. I’ve proposed two trades to set 5-30 flatteners, funded by selling the risk of a sharp repricing of the short end to lower rates. Both versions have positive roll-down, which is helpful if the UK situation remains muddled between domestic and global pressures.
Trade:
Buy GBP 1bn Floor on CMS 30-5 ATMF (k=0.16%)
Sell GBP 500mm 1y2y Receiver k=0.50% (around 18bp OTM)
for 3bp running
or
Buy GBP 1bn Floor on CMS 30-5 ATMF (k=0.16%)
Sell GBP 750mm 1y2y Receiver k=0.50% (around 18bp OTM)
for 0.5bp premium take out
Spot 2y at 0.71%
Spot 5y-30y at 0.12%
Rationale: With the change of government, and Chancellor, the so-called “Fiscal Rules” in the UK look vulnerable. The bounteous spending promises, if carried through, will likely increase Gilt supply, and historically this has impacted the belly of the curve (eg 5y-10y) more than the short or long ends. At the same time, and for the first time since its inception, the MPC will be heading for the backseat as fiscal expansion takes the wheel. So this gives two themes: flattening in 5-30 and selling volatility on short rates.
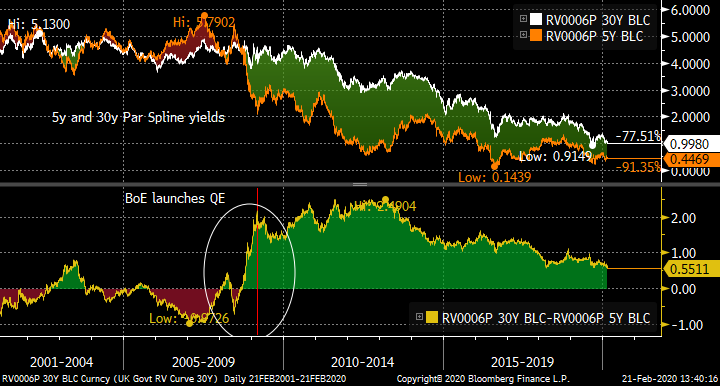
The chart shows the 5y-30y curve (in orange) and 2y spot swaps in white. The curve is sitting is firmly at the bottom of the range since the global financial crisis, but has been much flatter (indeed strongly inverted) in the sunnier times before that.
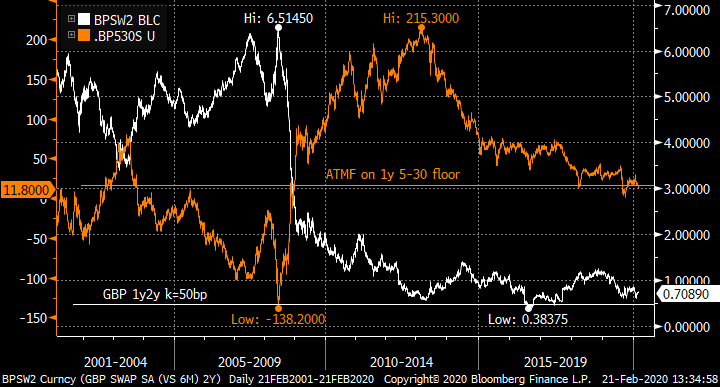
The combination of sharply reduced MPC rates and the onset of the QE programme drove a sharp steepening in the Gilt 5-30 curve in 2008/2009, as the 5y point led the way lower. It is not unreasonable to suggest that in the reverse move, where supply pushes the belly higher and the MPC moves eventually to wind down QE (it has said that the APF reinvestment would be reviewed when rates hit 1.25%, so 50bp from now) that 5y-30y would move back into the pre-GFC range.
The risk to the trade is clearly that the MPC turns dovish and/or the government does not follow through with its spending plans. The trade loses money if the 2y rate expires below 0.50% (as it seems likely that the 5-30 curve will be steeper).
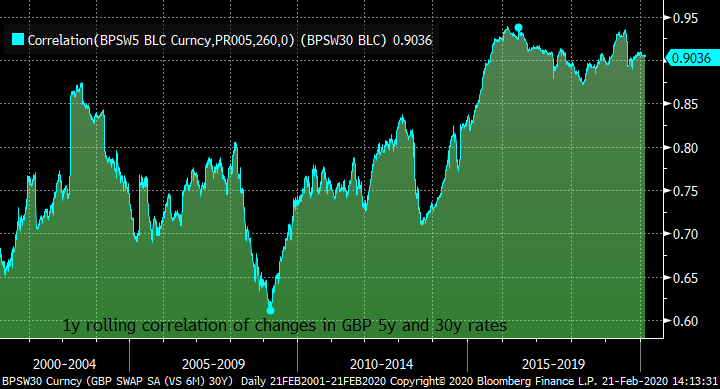
Looking at the implied curve volatility, GBP 5-30 curve vol is close to its lows of the past 3y, as the realized correlation between 5y and 30y rates is above 90% (chart). Historically, correlations have been significant weaker, and the scenario in which this trade works is precisely one where correlations should break lower.
Carry roll-down.
1bn x 500mm version: Given the convexity adjustment for the CMS floor, the trade has positive roll-down of 2.3bp over the first 6 months.
NPV P&L
Inception 3.3bp 0
After 3m 4.5bp 1.2bp
After 6m 5.6bp 2.3bp
After 9m 6.1bp 2.8bp
1bn x 750mm version: This has better rolldown characteristics as the 2y has a higher weight, and so the value of the roll further out of the money is higher
NPV P&L
Inception -0.4bp 0
After 3m 1.8bp 2.2bp
After 6m 4.0bp 4.4bp
After 9m 5.6bp 6bp
This trade is a macro call on the shift from monetarist to Keynesian polices, and the possible move by the UK towards “New Deal” infrastructure and other spending. The “BoE sitting on its hands” view is relatively consensus given the opposing forces on the UK economy, but the flattening is predicated on increased supply and higher yields.
Would love to hear your thoughts!
Best wishes
David
David Sansom
![]()
UK: 14-16 Dowgate Hill, London EC4R 2SU
US: 245 Park Ave, 39th Floor, NY, NY, 10167
Office: +44 (0) 203 143 4180
Mobile: +44 (0) 7976 204490
Email: david.sansom@astorridge.com
Web: www.AstorRidge.com
This marketing was prepared by David Sansom, a consultant with Astor Ridge. It is not appropriate to characterize this e-mail as independent investment research as referred to in MiFID and that it should be treated as a marketing communication even if it contains a trade recommendation. A history of marketing materials and research reports can be provided upon request in compliance with the European Commission’s Market Abuse Regulation. Astor Ridge takes no proprietary trading risk, has no market making facilities, and has no position in any security we discuss in this e-mail. The views in this e-mail are those of the author(s) and are subject to change, and Astor Ridge has no obligation to update its opinions or the information in this publication. If this e-mail contains opinions or recommendations, those opinions or recommendations reflect solely and exclusively those of the author, and such opinions were prepared independently of any other interests, including those of Astor Ridge and/or its affiliates. This publication does not constitute personal investment advice or take into account the individual financial circumstances or objectives of the those who receive it. The securities discussed herein may not be suitable for all investors. Astor Ridge recommends that investors independently evaluate each issuer, security or instrument discussed herein, and consult any independent advisors they believe necessary. The value of, and income from, any investment may fluctuate from day to day as a result of changes in relevant economic markets (including changes in market liquidity). The information herein is not intended to predict actual results, which may differ substantially from those reflected. Past performance is not necessarily indicative of future results.
You should not use or disclose to any other person the contents of this e-mail or its attachments (if any), nor take copies. This e-mail is not a representation or warranty and is not intended nor should it be taken to create any legal relations, contractual or otherwise. This e-mail and any files transmitted with it are confidential, may be legally privileged, and are for the sole use of the intended recipient. Copyright in this e-mail and any accompanying document created by Astor Ridge LLP is owned by Astor Ridge LLP.
Astor Ridge LLP is regulated by the Financial Conduct Authority (FCA): Registration Number 579287
Astor Ridge LLP is Registered in England and Wales with Companies House: Registration Number OC372185
Astor Ridge NA LLP is a member of FINRA/SIPC: CRD Number 282626
Astor Ridge NA LLP is Registered in England and Wales with Companies House: Registration Number OC401796
Trade: USD short-rates range-bound as Fed continues liquidity operations
Bottom line: The Fed appears unlikely to change course in the next few months, so here is a trade to play the range in USD short rates without excessive exposure to tail risk. Buying a payer fly caps the loss at the premium paid, while setting the low strike in-the-money gives a positive carry position.
Trade:
Buy USD 1bn 6m1y1y mid-curve payer 1x2x1 payer fly k=1.20% / 1.40% / 1.60%
For 3.3 bp running (mid indicative).
Spot 1y1y 1.28%. 6m ATMF 1.25%
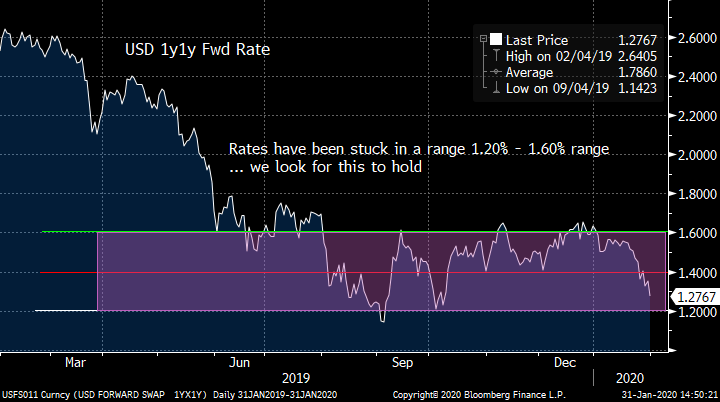
Rationale: The Fed has announced it will continue Bill purchases of $60bn / month until April, and expects to taper to $30bn in May and June. At the same time, the Fed is extending their repo operations until at least the end of April to ensure excess supply of reserves beyond their stated $1.5trn floor. To us, this pegs the short end of the USD curve for at least the next 3 months (end April) and arguably significantly longer than that. In this environment, it is interesting to look at low-risk ways of positioning for the status quo to hold. The global rally has pushed short rates lower in sympathy, towards the bottom of the past 6 months’ range.
The chart shows the USD 1y1y forward rate.
Because the low strike is in-the-money, the trade has positive roll as more of the intrinsic value it captured (and hence positive theta). In essence this makes it a short volatility position, but the downside is capped at the premium paid (unlike selling strangles).
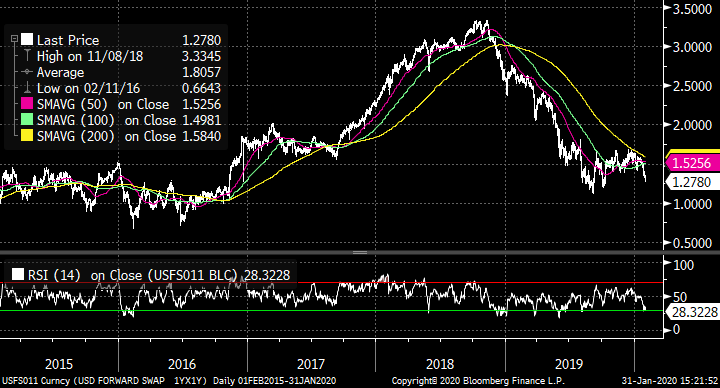
Technically, the 1y1y rate is flirting with over-sold territory, making the mildly bearish stance of this trade an interesting proposition. Daily RSI in chart:
Rolling the trade down the rate and volatility surface:
Date NPV ($) P&L
Inception 330k 0k
After 1m 350k +20k
After 2m 375k +45k
After 3m 410k +80k
After 4m 470k +140k
After 5m 590k +240k
Expiry 720k +390k
As we are currently towards the bottom of the strike range, this is essentially a bearish trade. The maximum payoff is 16.6 bp for a maximum downside of 3.4bp. A more aggressive structure would be to forego buying the high strike and converting to a 1x2 payer spread with unlimited downside if the Fed turns hawkish.
The main risk is that the Fed moves out of its wait-and-see mode. If 1y1y expires below 1.20%, or above 1.60%, the initial premium is lost.
As ever, we’d love to hear your thoughts.
Best wishes,
David
David Sansom
![]() image001.jpg@01D21F13.B69A4950">
image001.jpg@01D21F13.B69A4950">
UK: 14-16 Dowgate Hill, London EC4R 2SU
US: 245 Park Ave, 39th Floor, NY, NY, 10167
Office: +44 (0) 203 143 4180
Mobile: +44 (0) 7976 204490
Email: david.sansom@astorridge.com
Web: www.AstorRidge.com
This marketing was prepared by David Sansom, a consultant with Astor Ridge. It is not appropriate to characterize this e-mail as independent investment research as referred to in MiFID and that it should be treated as a marketing communication even if it contains a trade recommendation. A history of marketing materials and research reports can be provided upon request in compliance with the European Commission’s Market Abuse Regulation. Astor Ridge takes no proprietary trading risk, has no market making facilities, and has no position in any security we discuss in this e-mail. The views in this e-mail are those of the author(s) and are subject to change, and Astor Ridge has no obligation to update its opinions or the information in this publication. If this e-mail contains opinions or recommendations, those opinions or recommendations reflect solely and exclusively those of the author, and such opinions were prepared independently of any other interests, including those of Astor Ridge and/or its affiliates. This publication does not constitute personal investment advice or take into account the individual financial circumstances or objectives of the those who receive it. The securities discussed herein may not be suitable for all investors. Astor Ridge recommends that investors independently evaluate each issuer, security or instrument discussed herein, and consult any independent advisors they believe necessary. The value of, and income from, any investment may fluctuate from day to day as a result of changes in relevant economic markets (including changes in market liquidity). The information herein is not intended to predict actual results, which may differ substantially from those reflected. Past performance is not necessarily indicative of future results.
You should not use or disclose to any other person the contents of this e-mail or its attachments (if any), nor take copies. This e-mail is not a representation or warranty and is not intended nor should it be taken to create any legal relations, contractual or otherwise. This e-mail and any files transmitted with it are confidential, may be legally privileged, and are for the sole use of the intended recipient. Copyright in this e-mail and any accompanying document created by Astor Ridge LLP is owned by Astor Ridge LLP.
Astor Ridge LLP is regulated by the Financial Conduct Authority (FCA): Registration Number 579287
Astor Ridge LLP is Registered in England and Wales with Companies House: Registration Number OC372185
Astor Ridge NA LLP is a member of FINRA/SIPC: CRD Number 282626
Astor Ridge NA LLP is Registered in England and Wales with Companies House: Registration Number OC401796
Trade: Receive EUR 230 fly as a directionless range trade with good rolldown
Bottom Line: A butterfly trade on the EUR swap curve that offers an attractive entry level on the recent range, exhibits low directionality and offers significant rolldown.
Trade:
Pay EUR 490mm 1y2y swap
Recv EUR 280mm 1y7y swap
Pay EUR 33mm 1y30y swap
Recv the fly at -24.5 bp or better
Positive curve rolldown of 3.8 bp over the first 3 months
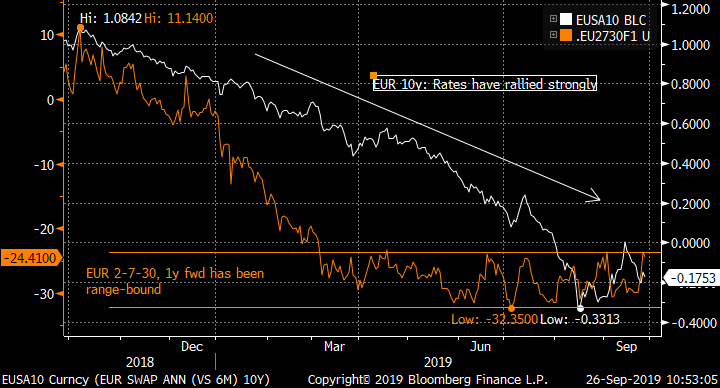
Rationale: In the current market, calling the next move in rates might be a challenge, and most curve segments and flies on the EUR curve are directional. However the EUR 2-7-30, 1y fwd fly represents an oasis of directionless calm: despite the significant and almost relentless rally, this fly has remained range-bound in the past 6 months.
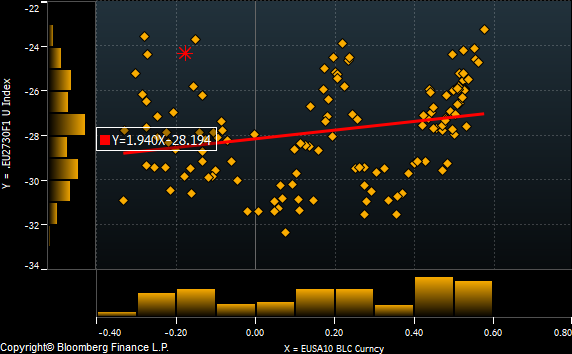
Put another way, this is the regression of the fly versus the belly rate, 1y7y. The R^2 is just 6% over the past 6 months, highly the absence of directionality.
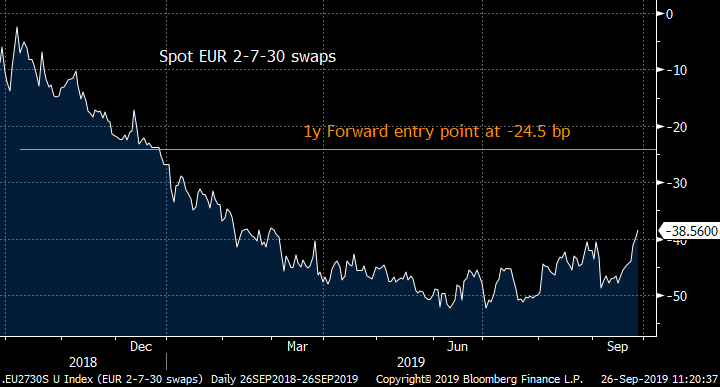
The other kicker is the significant rolldown on offer from receiving the 7y point on the EUR curve vs the wings. Entering the trade at the current forward level of -24.5bp compares very favourably with the spot 2-7-30 fly at -38.5. See chart:
The main risk is that this equilibrium is disturbed and the fly breaks out of the range to the upside. The large rolldown offers some cushion to mitigate this over time.
What do you think?
Best wishes
David
David Sansom
![]()
UK: 14-16 Dowgate Hill, London EC4R 2SU
US: 245 Park Ave, 39th Floor, NY, NY, 10167
Office: +44 (0) 203 143 4180
Mobile: +44 (0) 7976 204490
Email: david.sansom@astorridge.com
Web: www.AstorRidge.com
This marketing was prepared by David Sansom, a consultant with Astor Ridge. It is not appropriate to characterize this e-mail as independent investment research as referred to in MiFID and that it should be treated as a marketing communication even if it contains a trade recommendation. A history of marketing materials and research reports can be provided upon request in compliance with the European Commission’s Market Abuse Regulation. Astor Ridge takes no proprietary trading risk, has no market making facilities, and has no position in any security we discuss in this e-mail. The views in this e-mail are those of the author(s) and are subject to change, and Astor Ridge has no obligation to update its opinions or the information in this publication. If this e-mail contains opinions or recommendations, those opinions or recommendations reflect solely and exclusively those of the author, and such opinions were prepared independently of any other interests, including those of Astor Ridge and/or its affiliates. This publication does not constitute personal investment advice or take into account the individual financial circumstances or objectives of the those who receive it. The securities discussed herein may not be suitable for all investors. Astor Ridge recommends that investors independently evaluate each issuer, security or instrument discussed herein, and consult any independent advisors they believe necessary. The value of, and income from, any investment may fluctuate from day to day as a result of changes in relevant economic markets (including changes in market liquidity). The information herein is not intended to predict actual results, which may differ substantially from those reflected. Past performance is not necessarily indicative of future results.
You should not use or disclose to any other person the contents of this e-mail or its attachments (if any), nor take copies. This e-mail is not a representation or warranty and is not intended nor should it be taken to create any legal relations, contractual or otherwise. This e-mail and any files transmitted with it are confidential, may be legally privileged, and are for the sole use of the intended recipient. Copyright in this e-mail and any accompanying document created by Astor Ridge LLP is owned by Astor Ridge LLP.
Astor Ridge LLP is regulated by the Financial Conduct Authority (FCA): Registration Number 579287
Astor Ridge LLP is Registered in England and Wales with Companies House: Registration Number OC372185
Astor Ridge NA LLP is a member of FINRA/SIPC: CRD Number 282626
Astor Ridge NA LLP is Registered in England and Wales with Companies House: Registration Number OC401796
Trade: Markets running in one direction: position for a repeat of the "Bund Tantrum"
Bottom line: As a parent of a 6-yr old boy on the autistic spectrum, tantrums are a fact of life. In my experience, there are two complementary strategies for coping: first understanding the warning signs and triggers that precede a possible meltdown; and second being prepared to ride out the subsequent storm. With 10y yields in the Eurozone making new lows, swirling talk of a new ECB accommodation, and a gloomy economic assessment, one could argue that the precursors are again in place for a “behavioural episode” in yields and a repeat of the Bund tantrum of April 2015. Here, I suggest ways to pay the EUR 5y-10y-30y fly conditionally as a way to position for a sharp sell-off, without overexposure to the chance that the rally continues unabated.
Trades:
A: Payer swaptions
Sell EUR 200mm 3m5y ATMF payer (k=-0.443%)
Buy EUR 200mm 3m10y ATMF payer (k=-0.179%)
Sell EUR 35mm 3m30y ATMF payer (k=+0.214%)
For a premium take out of 0.3bp (mid indicative)
ATMF strike at -12.9bp. Spot at -15.5 bp.
Equivalent to EUR 100k/bp underlying on the wings.
B: CMS Curve caps
Buy EUR 1bn 3m SL cap on CMS 10-5 ATMF (k=26.3bp)
Sell EUR 1bn 3m SL cap on CMS 30-10 ATMF (k=41.2bp)
For a premium take out of 1.3bp (mid indicative)
ATMF strike at -14.9bp. Spot at -15.5bp.
Equivalent to EUR 100k/bp underlying on the wings
C: CMS Curve caps with correlation overlay
Buy EUR 2bn 3m SL cap on CMS 10-5 ATMF (k=26.3bp)
Sell EUR 1bn 3m SL cap on CMS 30-5 ATMF (k=68.4bp)
For a premium take out of 0.25bp (mid indicative)
Rationale. In April 2015, a year-long rally was dramatically interrupted by near 100bp sell-off in Bund yields. In hindsight this allowed the longs to reload and yields subsequently found new lows a year later, but it did constitute an abrupt awakening for the markets. Being long the EUR bond market had been a lucrative position in 2014 as the prospects for QE from the ECB moved from a possibility to a reality. This positioning also likely exacerbated the correction as investors rushed to get flat to book profit.
Generic German 10y yield:
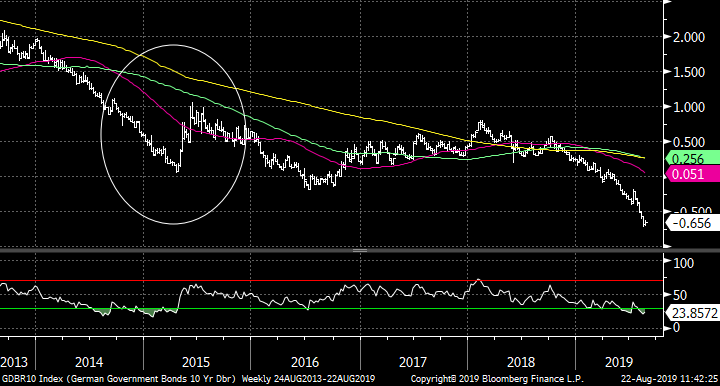
The current situation has many parallels with 2015: yields have been falling for a year, and there are profits to be taken; and the market is pricing ECB deposit rate cuts, while the possibility of new QE purchases is to some extent also priced. The tantrum in 2015 did not occur until QE had actually begun in March, so the current uncertainty could persist and prevent any major move until at least after the September ECB meeting. So rumours of the demise of the rally could be premature, but that does not preclude buying insurance against such a move if the premium is attractive.
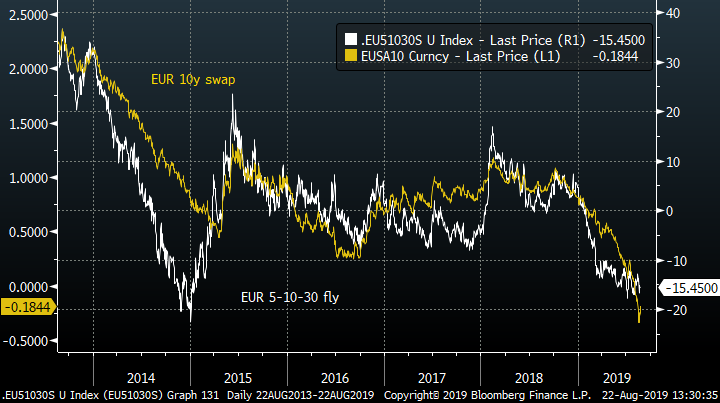
One indicator which saw an even larger relative swing was EUR curvature. The chart shows the 5-10-30 swap fly, compared to the belly 10y rate. The belly rallied consistently vs the wings for all of 2014, then began to reverse at the start of 2015. For most of this year, the fly headed lower in line with rates, and even though the pace of the fall has reduced, we are still close to the historical low of end-14. Certainly we could expect that a sharp sell-off in rates would send the fly higher. Thus a pay position in the 5-10-30 fly is a bearish position in the event of a large sell off.
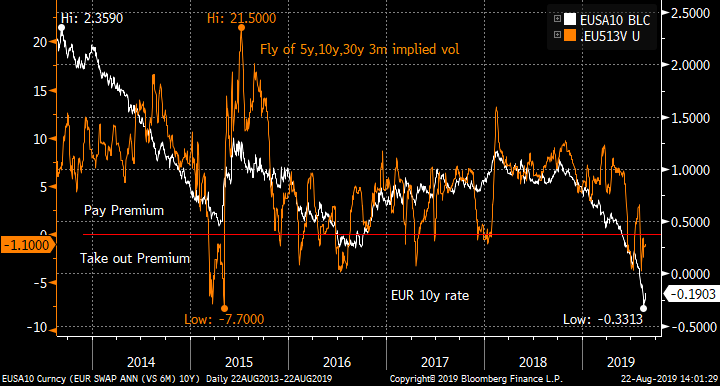
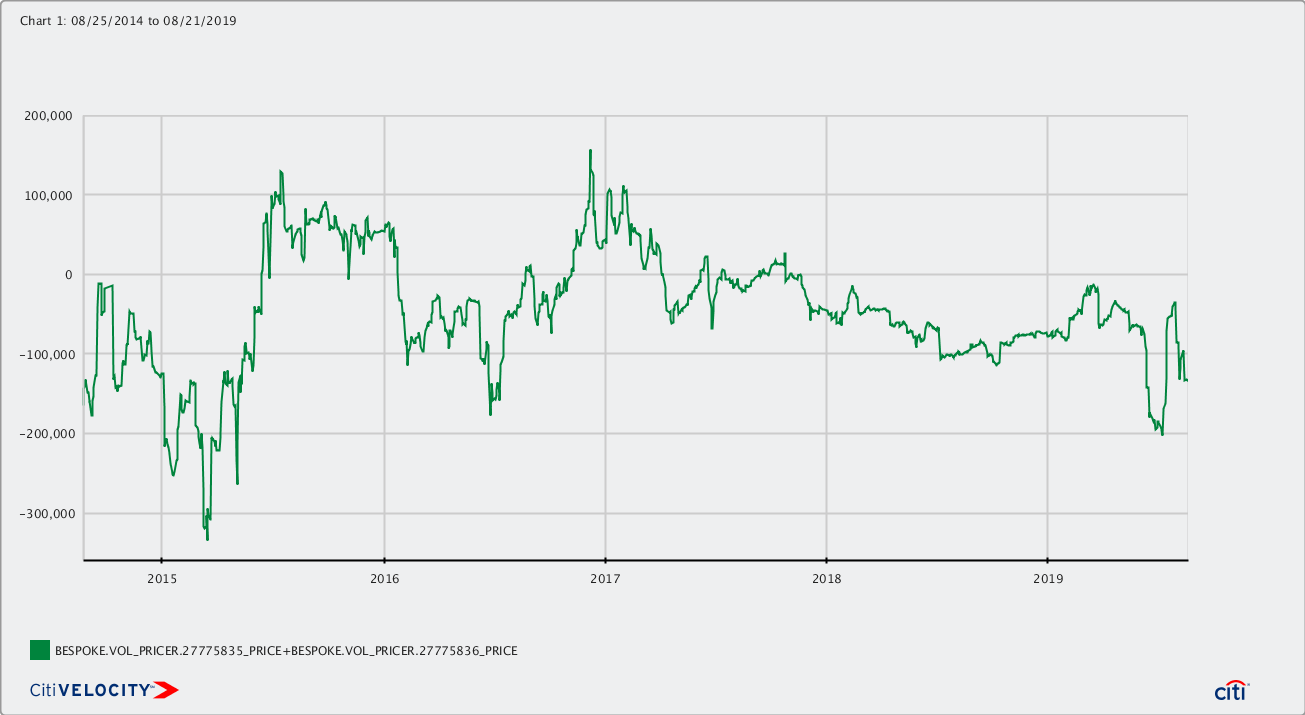
Even if one is convinced of the likelihood of a reversal, the abrupt rally begs the question of when to set the position. Given that the ECB has not made a definitive move yet, and the FOMC could yet deliver significant cuts, the rally may have further to go. This suggests we should be looking at a conditional version of this fly using payers (buy payers on 10y, sell them on 5y and 30y). Usually this would require some upfront net premium to be paid, which mitigates against the trade, especially given the negative carry of ATMF strikes versus spot levels. However, recently there has been a strong bid on 30y tails in the volatility market: the chart shows the fly of the 5y,10y and 30y implied vols in orange, which has dropped through zero.
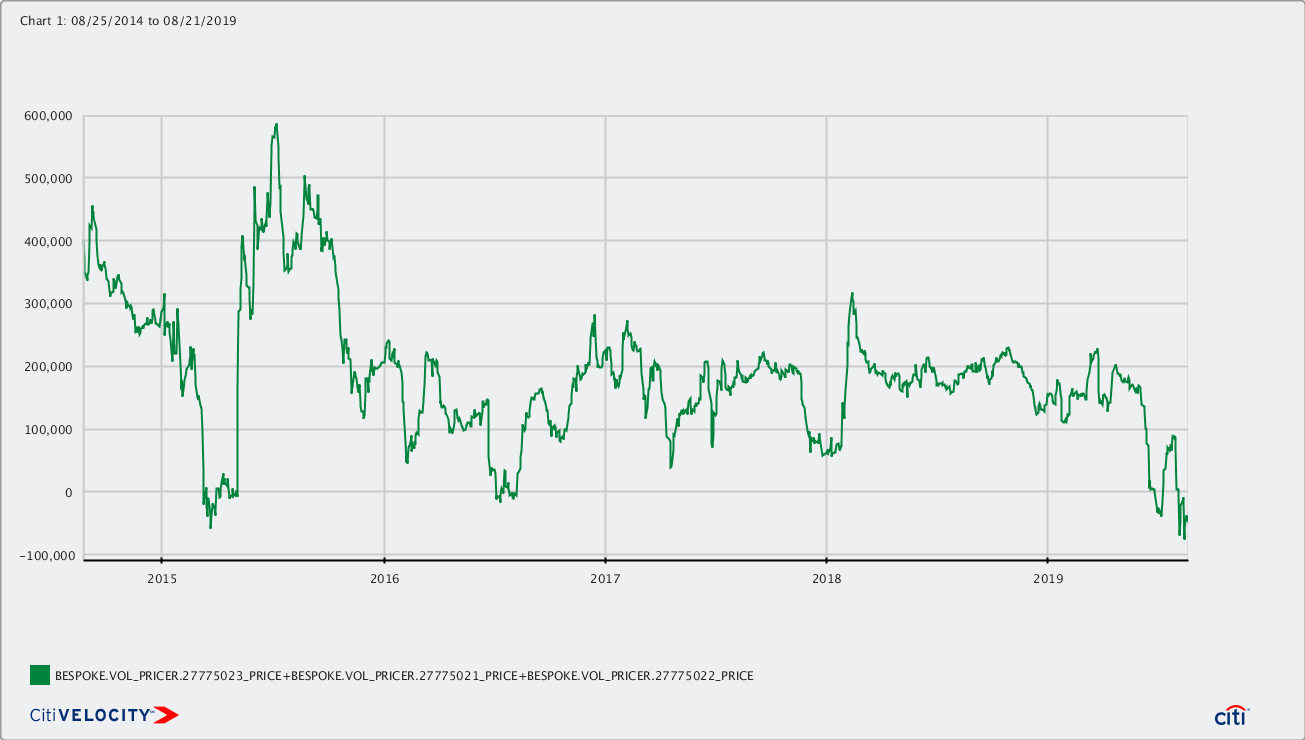
This is the premium of the ATMF 3m payer fly (for 100k/bp underlying wings), which, at -0.25bp, is pretty much the lowest level for the past five years.
One of the detriments of paying the 5-10-30 in vanilla swaps is the negative carry: 2.6bp over the first 3 months. This is still present in the payer fly version. The forward fly is struck at -12.8bp vs the spot swap fly at -15.4bp. However, given that the fly topped out at around +20bp at the peak of the 2015 Bund tantrum, there is still a decent potential P&L.
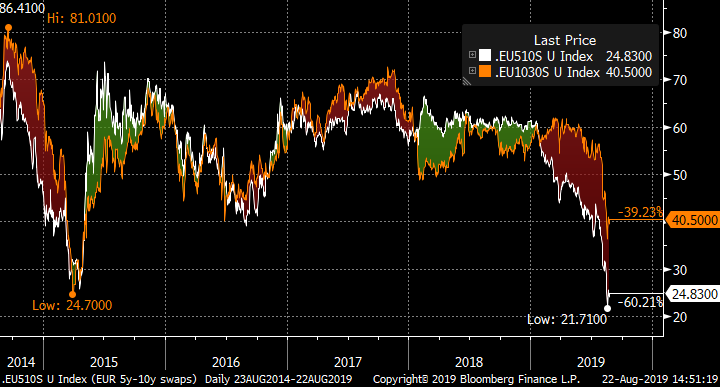
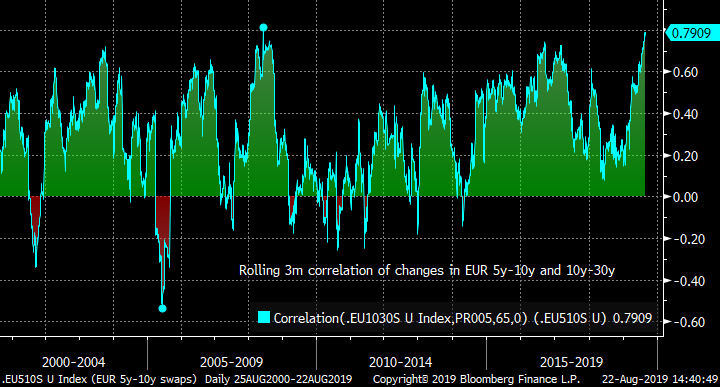
Another point to note is the rarity of the current curve situation in EUR. The chart is the rolling 3m (65 business day) correlation between the 5y-10y and 10y-30y curve segments (as the 5-10-30 fly is the difference of the two slopes). This correlation is very much at anomalously high levels, which means that the 5-10-30 fly is unusually stable. Any move lower in correlation implies that the 5-10-30 fly should move.
In a re-run of the 2015 Bund tantrum, both the 5y-10y and 10y-30y curve segments steepened sharply, but the 5y-10y segment led the way, taking the 5-10-30 fly rapidly higher. Thus an alternative to using payer swaptions is to use the spread of two CMS caps: buying a cap on 5y-10y and selling one on 10y-30y. The current implied volatility levels allow a premium take-out. The paper carry position is also improved by the CMS convexity adjustment on the caps. The historical net premium is shown in the next chart.
Chart of premium of CMS 3m caps on 5y-10y vs 10y-30y.
As a final suggestion, one can fade the high level of implied correlation between 5y-10y and 10y-30y with this structure:
Buy 1bn 3m SL cap on 10-5
Buy 1bn 3m SL cap on 30-10
Sell 1bn 3m SL cap on 30-5
If the two sectors were perfectly correlated, then the cost of this structure should approach zero. Right now it costs around 0.8bp, which is the maximum loss on the structure. Hence a further version of the 5-10-30 payer would be to combine the curve cap trade with this correlation play. The net result would be this trade:
Buy 2bn 3m SL cap on 10-5
Sell 1bn 3m SL cap on 30-5
For a premium take-out of 0.25bp (mid indicative)
These are all zero cost trades … what’s the catch? The primary risk of these trades is an anomalous sell-off in 30y rates ie: the 5-10-30 fly heads lower in a sell-off, and 10-30 out-steepens 5-10. Were the ECB to rule out QE, then 30y yields would rise, but the whole curve will steepen, and history suggests that 5y-10y would steepen faster as the belly leads the sell-off, but this is not guaranteed. A further pickup of implied volatility on 30y tails compared to 10y would give a negative mark-to-market, as would a further rally (although this would move all strikes out of the money).
There are several more permutations … let me know if you want to hear more!
Best wishes,
David
David Sansom
![]()
UK: 14-16 Dowgate Hill, London EC4R 2SU
US: 245 Park Ave, 39th Floor, NY, NY, 10167
Office: +44 (0) 203 143 4180
Mobile: +44 (0) 7976 204490
Email: david.sansom@astorridge.com
Web: www.AstorRidge.com
This marketing was prepared by David Sansom, a consultant with Astor Ridge. It is not appropriate to characterize this e-mail as independent investment research as referred to in MiFID and that it should be treated as a marketing communication even if it contains a trade recommendation. A history of marketing materials and research reports can be provided upon request in compliance with the European Commission’s Market Abuse Regulation. Astor Ridge takes no proprietary trading risk, has no market making facilities, and has no position in any security we discuss in this e-mail. The views in this e-mail are those of the author(s) and are subject to change, and Astor Ridge has no obligation to update its opinions or the information in this publication. If this e-mail contains opinions or recommendations, those opinions or recommendations reflect solely and exclusively those of the author, and such opinions were prepared independently of any other interests, including those of Astor Ridge and/or its affiliates. This publication does not constitute personal investment advice or take into account the individual financial circumstances or objectives of the those who receive it. The securities discussed herein may not be suitable for all investors. Astor Ridge recommends that investors independently evaluate each issuer, security or instrument discussed herein, and consult any independent advisors they believe necessary. The value of, and income from, any investment may fluctuate from day to day as a result of changes in relevant economic markets (including changes in market liquidity). The information herein is not intended to predict actual results, which may differ substantially from those reflected. Past performance is not necessarily indicative of future results.
You should not use or disclose to any other person the contents of this e-mail or its attachments (if any), nor take copies. This e-mail is not a representation or warranty and is not intended nor should it be taken to create any legal relations, contractual or otherwise. This e-mail and any files transmitted with it are confidential, may be legally privileged, and are for the sole use of the intended recipient. Copyright in this e-mail and any accompanying document created by Astor Ridge LLP is owned by Astor Ridge LLP.
Astor Ridge LLP is regulated by the Financial Conduct Authority (FCA): Registration Number 579287
Astor Ridge LLP is Registered in England and Wales with Companies House: Registration Number OC372185
Astor Ridge NA LLP is a member of FINRA/SIPC: CRD Number 282626
Astor Ridge NA LLP is Registered in England and Wales with Companies House: Registration Number OC401796
Trade: Position for QE disappointment from the ECB, using mid-curve payers
Bottom line: The market is getting excited on the prospect of a new QE programme, but what if it is disappointed and the ECB baulks at a meaningful purchasing volume (as this requires politically and technically difficult rule changes)? This leveraged trade in mid-curve payers positions for a steepening outcome where the ECB cuts rates as priced by the market but prevaricates on QE. The trade rolls positively by 3bp over the first 3 months.
Trade:
Sell EUR 980mm 6m2y1y mid-curve payer ATMF (k=-0.30%)
Buy EUR 105mm 6m10y10y mid-curve payer spread ATMF / ATMF+25bp (k=1.12% / 1.37%)
For premium take-out of 0.5bp running (mid indication)
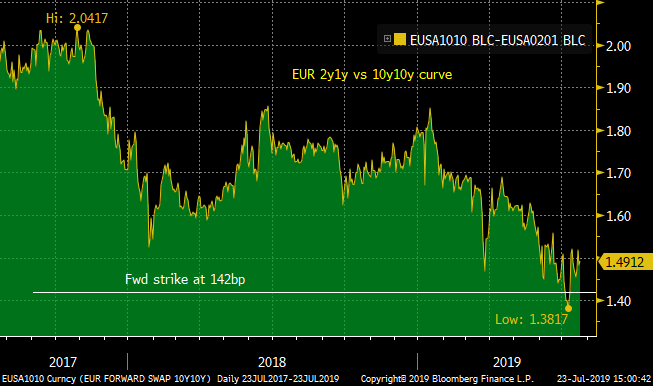
Fwd 2y1y/10y10y curve entry at 142bp
Spot curve at 149bp.
Charts:
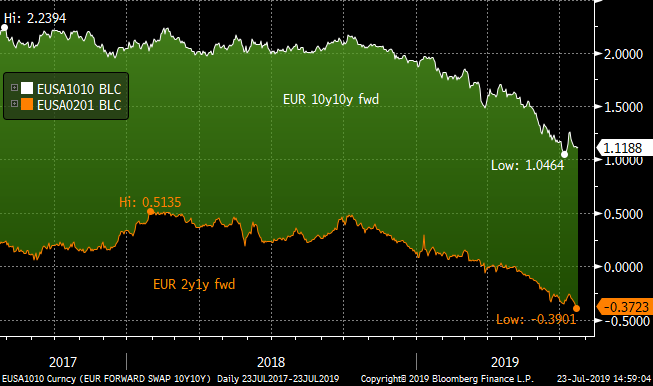
The 2y1y/10y10y curve has been reliably directional: the 10y10y rates moves approximately 1.5bp for every 1bp that 2y1y moves (chart). This ratio is mirrored in the implied volatilities of the mid-curve options. Hence the curve has been bull-flattening and bear-steepening.
Scenarios:
- ECB cuts rates 10bp and signals significant QE: all rates rally, curve flattens, and all payers expire out-of-the-money for zero P&L.
- ECB cuts rates 10bp, but disappoints on QE programme: 2y1y moves little, but 10y10y vulnerable to a sell-off: trades makes up to 25bp.
- ECB does nothing on rates or QE: all rates sell-off but 10y10y moves more. As long as 2y1y does not sell-off more than 25bp, the trade has a positive P&L.
- ECB doesn’t cut rates, but announces sizeable QE programme: 2y1y sells off, while 10y10y could rally, and the trade loses money.
The main risk to the trade is that the ECB chooses to disappoint on rates, but deliver on QE. As I outline below, I see the barrier to re-launching QE to be much higher than a simple rate cut.
Trade Roll (on rate and vol surface):
Time PV Change
Inception 0
After 1m +1 bp
After 2m +1.7 bp
After 3m +3.4 bp
After 4m +4.0 bp
After 5m +4.4 bp
Expiry 0 bp
This is perhaps the most aggressive and leveraged expression of the QE disappointment view. One alternative is to have a payer spread on both legs:
Sell EUR 980mm 6m2y1y mid-curve payer spread ATMF / ATMF+25bp (k=-0.30% / k=-0.05%)
Buy EUR 105mm 6m10y10y mid-curve payer spread ATMF / ATMF+25bp (k=1.12% / 1.37%)
For an upfront premium of 2.3bp
3m rolldown: +1.3 bp
This caps the downside in a large-scale reversal of ECB expectations which takes cuts completely off the table (and more). However if ECB cuts and QE is delivered, the premium is forfeit.
Rationale: For my part, the central expectation for the ECB over the coming months is a cut of 10bp in the deposit rate at the September meeting and some move on QE in December. However around that, there are plenty of permutations, and I want to explore the possibility that QE is either not restarted, or is done so at an anaemic rate.
What might make the Governing Council pause for thought before re-starting new QE purchases? The main issue is that in some countries the stock of available government and agency bonds for purchasing is restricted by the issue limit of 33%. This limit was imposed early in the programme on desire to avoid a situation in which a National Central Bank could use its bondholding to block any restructuring proposal of that nation’s debt. The model collective action clauses added to European government bonds following the sovereign debt crisis have this 33% threshold written in. Since Germany accounts for 18% of purchases by value under the Capital Key, it is often used held up as the exemplar of this restriction, but other countries also have limited stock.
I put out a piece last week on the estimates from my Maximum Likelihood model for what the Bundesbank currently holds, and what headroom it has for further purchases. The table below summarizes the possible rate of ECB total monthly purchasing, and the estimated number of months that the Bundesbank could adhere to this remit under the current Capital Key allocation.
|
PSPP2 Monthly Net Purchases (EUR bn/month) |
Existing 33% |
Non-CAC @ 50% |
All @ 50% |
|
80 |
8 |
17 |
44 |
|
60 |
11 |
24 |
71 |
|
30 |
30 |
56 |
Unlimited |
|
10 |
Unlimited |
Unlimited |
Unlimited |
Thus the ECB is somewhat caught … it could restart QE at 30bn / month and continue for at least two years without changing the rules, but 30bn is fairly lacklustre (given the original programme was 80bn / month at its height) and could be interpreted by the market as neither one thing nor the other (30bn was part of the tapering of purchases as the programme was being wound down). Perhaps the ECB would be content with this “symbolic” measure, not least because it doesn’t require the thorny decision-making on how to amend the QE rules, but they run the risk of leaving the market disappointed. To restart at a higher rate would require either adjustments to the per-issue holding limit, or some tinkering with the Capital Key allocation to individual National Central Banks, neither of which approaches are free of technical, legal and not the least political considerations. This is where the timing of the ascension of Mme Lagarde to the ECB Presidency comes into play: would the Governing Council contemplate such tricky and possibly divisive manoeuvres in advance of a new regime? BREXIT, with the new deadline of 31st October, is another consideration as the ramifications of a messy divorce provide a headwind to the prospects for the Euro area economy. Wider trade worries have the potential to be exacerbated or mitigated in coming months and this is yet another source of timing uncertainty.
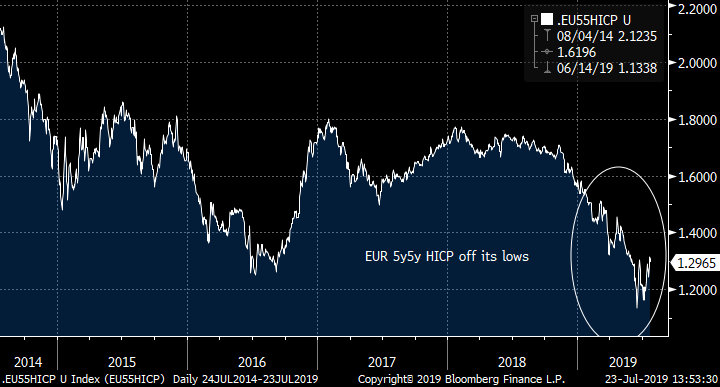
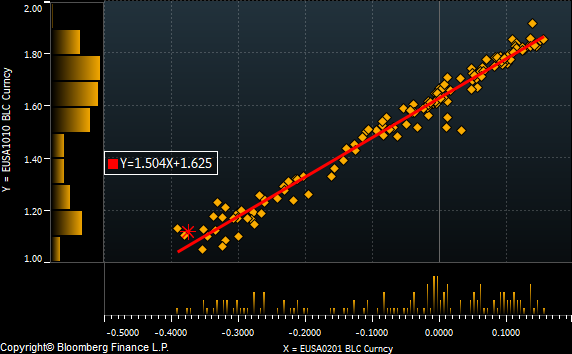
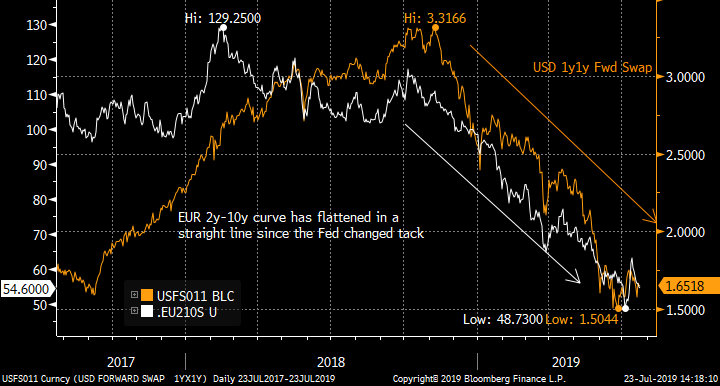
It has been suggested that Mario Draghi (and the GC as a whole) has been spooked by the rapid collapse in long-dated inflation expectations (as exemplified by the 5y5y HICP ZC rate above). These have recovered in recent days, so some may question the urgency of the need to take action which might expose political divisions, while others might suggest that this is the market pricing imminent and effective ECB action. European rates have been on a downward trend since before the start of the year, as the market prices cuts from the FOMC, so why should the ECB look to flatten the curve further via QE when the rally in the belly of the curve has done much already? The EUR 2y-10y swap curve has flattened almost 50bp this year in pretty much a straight line tracking Fed expectations, and this flattening speed was essentially constant even when a re-started QE programme came into view.
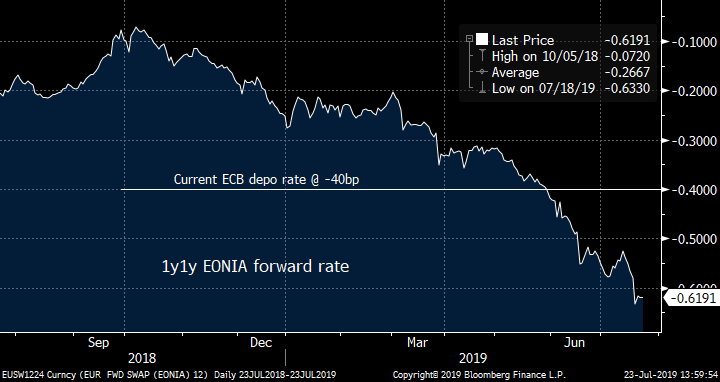
At the short end, ECB rates are now pricing cuts, with 1y1y EONIA now at -60bp suggesting two cuts of 10bp over the coming year. So now, if the ECB is to impress the market with its resolution to raise inflation expectations, these cuts start to look like the minimum the ECB has to deliver.
So the essence of my thesis is that the ECB will find it easier to cut rates in order to “do something”, and that the more arduous task of re-starting QE at a meaningful rate will be postponed. Thus the market’s expectations on the short end evolution of rates will be met, but it will be liable to disappointment on prospects for a flatter curve.
As ever, I would love to hear your thoughts!
Best wishes,
David
David Sansom
![]() image001.jpg@01D21F13.B69A4950">
image001.jpg@01D21F13.B69A4950">
UK: 14-16 Dowgate Hill, London EC4R 2SU
US: 245 Park Ave, 39th Floor, NY, NY, 10167
Office: +44 (0) 203 143 4180
Mobile: +44 (0) 7976 204490
Email: david.sansom@astorridge.com
Web: www.AstorRidge.com
This marketing was prepared by David Sansom, a consultant with Astor Ridge. It is not appropriate to characterize this e-mail as independent investment research as referred to in MiFID and that it should be treated as a marketing communication even if it contains a trade recommendation. A history of marketing materials and research reports can be provided upon request in compliance with the European Commission’s Market Abuse Regulation. Astor Ridge takes no proprietary trading risk, has no market making facilities, and has no position in any security we discuss in this e-mail. The views in this e-mail are those of the author(s) and are subject to change, and Astor Ridge has no obligation to update its opinions or the information in this publication. If this e-mail contains opinions or recommendations, those opinions or recommendations reflect solely and exclusively those of the author, and such opinions were prepared independently of any other interests, including those of Astor Ridge and/or its affiliates. This publication does not constitute personal investment advice or take into account the individual financial circumstances or objectives of the those who receive it. The securities discussed herein may not be suitable for all investors. Astor Ridge recommends that investors independently evaluate each issuer, security or instrument discussed herein, and consult any independent advisors they believe necessary. The value of, and income from, any investment may fluctuate from day to day as a result of changes in relevant economic markets (including changes in market liquidity). The information herein is not intended to predict actual results, which may differ substantially from those reflected. Past performance is not necessarily indicative of future results.
You should not use or disclose to any other person the contents of this e-mail or its attachments (if any), nor take copies. This e-mail is not a representation or warranty and is not intended nor should it be taken to create any legal relations, contractual or otherwise. This e-mail and any files transmitted with it are confidential, may be legally privileged, and are for the sole use of the intended recipient. Copyright in this e-mail and any accompanying document created by Astor Ridge LLP is owned by Astor Ridge LLP.
Astor Ridge LLP is regulated by the Financial Conduct Authority (FCA): Registration Number 579287
Astor Ridge LLP is Registered in England and Wales with Companies House: Registration Number OC372185
Astor Ridge NA LLP is a member of FINRA/SIPC: CRD Number 282626
Astor Ridge NA LLP is Registered in England and Wales with Companies House: Registration Number OC401796
PSPP2: What's available to buy, and what happens to Bunds if the ECB restarts QE?
Bowing to popular demand (!), I have reinstated my PSPP2 maximum likelihood model to assess the Bund curve impact of any reboot of QE. The mathematics of the available PSPP2 stock are that the ECB will have to adjust the rules (ie the issue limits) if the Bundesbank is to be able to restart new purchases at almost any rate. The least problematic route (legally) would be to increase the per-issue purchasing limits to 50% on non-CAC bonds, in which case the 15y-25y sector should perform versus on-the-run 10y and 30y as the QE money chases after the older, more closely-held paper. Should the ECB find a justification for increasing the limits on all bonds, we could see the 7y sector richen vs the 5y and 10y supply points.
Here’s the chart:
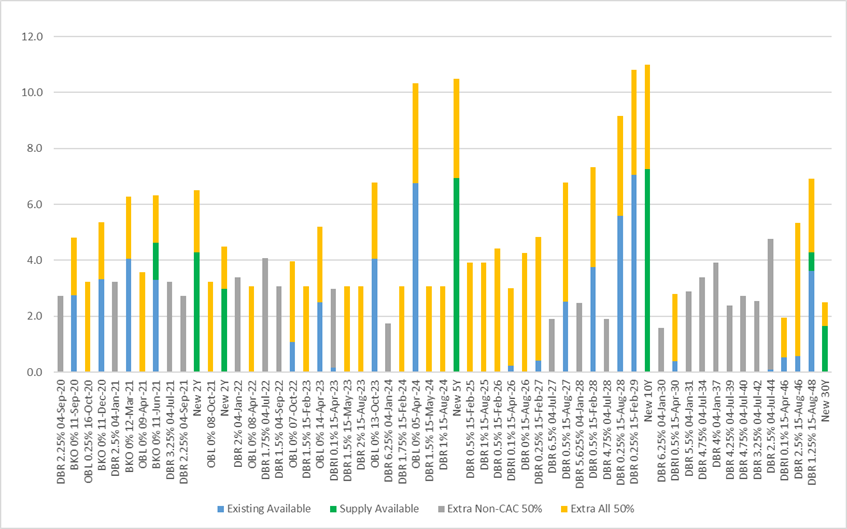
The blue columns show the estimated notional amounts of existing government bonds that available for PSPP2 purchasing under the current rules as of the end of June. As I’ve outlined before, the available stock is grouped around the supply points of 2y,5y,10y and 30y. The green lines show the supply for the remainder of 2019 (from end June, so the new 5y and 10y bonds appear as they are not currently in the published PSPP2 portfolio). The grey lines show the additional available purchasable stock which would be released if the per-issue limit were raised to 50% (from 33%) on those older bonds without a Collective Action Clause (CAC). Finally the orange lines show the extra paper that would be opened up if the issue limit were increased to 50% for all bonds (CAC and non-CAC).
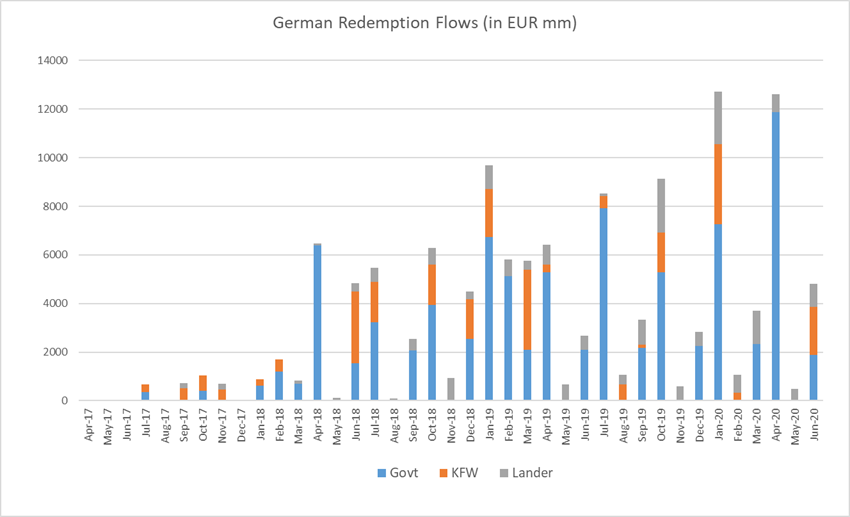
As others have pointed out, without rule changes the Bundesbank will struggle to spend the new purchase money. The redemption flows from the existing portfolio (which average around 3.2bn/month over 2019) will take up the lion’s share of the available paper, leaving little room for new purchases.
Despite the disparities between old and newer bonds, the high-level impact of a QE restart with rule changes is not that large. Here are the WAMs (using notionals) under the various scenarios (which represent the start of play at the end of 2019 … given the consensus for a possible ECB announcement in December).
|
End-19 WAM Market |
7.7 |
|
End-19 WAM Available |
7.2 |
|
End-19 50% Non-CAC |
8.2 |
|
End-19 50% All |
7.8 |
Hence currently the available universe of purchasable paper is actually slightly shorter than the WAM of the market (7.2y vs 7.7y). However, if the rules are changed to increase the limit to 50% for non-CAC bonds, this WAM lengthens by a year to 8.2y. If all bonds are opened up with increased limits then I estimate a WAM of 7.8y which varies little from the current situation.
However, the chart highlights that the sectors that would benefit the most if the ECB started by increasing the limit on non-CAC bonds to 50% would be primarily the 15y and 25y area (Jan-30 to Jul-44). To a lesser extent bonds in the 3y to 7y bucket should also get a boost. Should the limit be increased for all bonds, all the older bonds should perform against the on-the-runs / supply points, but especially in the 7y area vs 5y and 10y.
As an aside, here are my model’s anticipated redemption flows over the coming year. Bear in mind that the rules since January allow the Bundesbank to spread out the reinvestment of principal redemptions over a 12-month window, though it is unclear how much they avail themselves of this flexibility.
|
Redemptions (EUR mm) |
||||
|
Govt |
KFW |
Lander |
Total |
|
|
Apr-17 |
0 |
0 |
0 |
0 |
|
May-17 |
0 |
0 |
0 |
0 |
|
Jun-17 |
0 |
0 |
0 |
0 |
|
Jul-17 |
343 |
336 |
0 |
679 |
|
Aug-17 |
0 |
0 |
0 |
0 |
|
Sep-17 |
0 |
522 |
210 |
731 |
|
Oct-17 |
408 |
627 |
0 |
1035 |
|
Nov-17 |
0 |
463 |
234 |
697 |
|
Dec-17 |
0 |
0 |
0 |
0 |
|
Jan-18 |
609 |
277 |
0 |
886 |
|
Feb-18 |
1191 |
499 |
0 |
1690 |
|
Mar-18 |
684 |
0 |
142 |
826 |
|
Apr-18 |
6400 |
0 |
61 |
6460 |
|
May-18 |
0 |
0 |
105 |
105 |
|
Jun-18 |
1530 |
2970 |
339 |
4839 |
|
Jul-18 |
3238 |
1650 |
581 |
5470 |
|
Aug-18 |
0 |
0 |
95 |
95 |
|
Sep-18 |
2059 |
0 |
478 |
2537 |
|
Oct-18 |
3948 |
1650 |
699 |
6297 |
|
Nov-18 |
0 |
0 |
941 |
941 |
|
Dec-18 |
2534 |
1650 |
321 |
4504 |
|
Jan-19 |
6735 |
1980 |
964 |
9679 |
|
Feb-19 |
5125 |
0 |
673 |
5798 |
|
Mar-19 |
2086 |
3300 |
366 |
5753 |
|
Apr-19 |
5280 |
318 |
824 |
6423 |
|
May-19 |
0 |
0 |
680 |
680 |
|
Jun-19 |
2083 |
0 |
593 |
2676 |
|
Jul-19 |
7920 |
495 |
99 |
8514 |
|
Aug-19 |
0 |
660 |
393 |
1053 |
|
Sep-19 |
2182 |
126 |
1039 |
3346 |
|
Oct-19 |
5280 |
1650 |
2195 |
9125 |
|
Nov-19 |
0 |
0 |
604 |
604 |
|
Dec-19 |
2242 |
0 |
578 |
2819 |
|
Jan-20 |
7260 |
3300 |
2153 |
12713 |
|
Feb-20 |
0 |
328 |
743 |
1071 |
|
Mar-20 |
2327 |
0 |
1370 |
3696 |
|
Apr-20 |
11880 |
0 |
743 |
12623 |
|
May-20 |
0 |
0 |
495 |
495 |
|
Jun-20 |
1885 |
1980 |
957 |
4822 |
The current state of play according to my model. The figures released by the ECB suggest reduced Bund buying in June (as shown by the fall in the cumulative portfolio size for Germany), though my model still shows 1bn of buying of Lander paper (per-issue details on request).
|
Bond |
Opened |
O/S (bn) |
Purchasable |
Market Yield |
Purchased |
% Purchased |
Remaining |
Margin of Error |
MV Remaining |
Jun-19 Buying |
|
DBR 3.75% 04-Jan-17 |
Nov-06 |
0.0 |
0.0 |
|
0.0 |
|
0.0 |
|
0.0 |
0.00 |
|
OBL 0.75% 24-Feb-17 |
Jan-12 |
0.0 |
0.0 |
|
0.0 |
|
0.0 |
|
0.0 |
0.00 |
|
BKO 0% 10-Mar-17 |
Feb-15 |
0.0 |
0.0 |
|
0.0 |
|
0.0 |
|
0.0 |
0.00 |
|
OBL 0.5% 07-Apr-17 |
May-12 |
0.0 |
0.0 |
|
0.0 |
|
0.0 |
|
0.0 |
0.00 |
|
BKO 0% 16-Jun-17 |
May-15 |
0.0 |
0.0 |
|
0.0 |
|
0.0 |
|
0.0 |
0.00 |
|
DBR 4.25% 04-Jul-17 |
May-07 |
0.0 |
0.0 |
|
0.3 |
|
0.0 |
+/- 6% |
0.0 |
0.00 |
|
BKO 0% 15-Sep-17 |
Aug-15 |
0.0 |
0.0 |
|
0.0 |
|
0.0 |
|
0.0 |
0.00 |
|
OBL 0.5% 13-Oct-17 |
Sep-12 |
0.0 |
0.0 |
|
0.4 |
|
0.0 |
+/- 4% |
0.0 |
0.00 |
|
BKO 0% 15-Dec-17 |
Nov-15 |
0.0 |
0.0 |
|
0.0 |
|
0.0 |
|
0.0 |
0.00 |
|
DBR 4% 04-Jan-18 |
Nov-07 |
0.0 |
0.0 |
|
0.6 |
|
0.0 |
+/- 3% |
0.0 |
0.00 |
|
OBL 0.5% 23-Feb-18 |
Jan-13 |
0.0 |
0.0 |
|
1.2 |
|
0.0 |
+/- 3% |
0.0 |
0.00 |
|
BKO 0% 16-Mar-18 |
Feb-16 |
0.0 |
0.0 |
|
0.7 |
|
0.0 |
+/- 3% |
0.0 |
0.00 |
|
OBL 0.25% 13-Apr-18 |
May-13 |
0.0 |
0.0 |
|
1.9 |
|
0.0 |
+/- 2% |
0.0 |
0.00 |
|
OBLI 0.75% 15-Apr-18 |
Apr-11 |
0.0 |
0.0 |
|
4.5 |
|
0.0 |
+/- 1% |
0.0 |
0.00 |
|
BKO 0% 15-Jun-18 |
May-16 |
0.0 |
0.0 |
|
1.5 |
|
0.0 |
+/- 3% |
0.0 |
0.00 |
|
DBR 4.25% 04-Jul-18 |
May-08 |
0.0 |
0.0 |
|
3.2 |
|
0.0 |
+/- 1% |
0.0 |
0.00 |
|
BKO 0% 14-Sep-18 |
Aug-16 |
0.0 |
0.0 |
|
2.1 |
|
0.0 |
+/- 2% |
0.0 |
0.00 |
|
OBL 1% 12-Oct-18 |
Sep-13 |
0.0 |
0.0 |
|
3.9 |
|
0.0 |
+/- 1% |
0.0 |
0.00 |
|
BKO 0% 14-Dec-18 |
Nov-16 |
0.0 |
0.0 |
|
2.5 |
|
0.0 |
+/- 2% |
0.0 |
0.00 |
|
DBR 3.75% 04-Jan-19 |
Nov-08 |
0.0 |
0.0 |
|
6.7 |
|
0.0 |
+/- 1% |
0.0 |
0.00 |
|
OBL 1% 22-Feb-19 |
Jan-14 |
0.0 |
0.0 |
|
5.1 |
|
0.0 |
+/- 1% |
0.0 |
0.00 |
|
BKO 0% 15-Mar-19 |
Mar-17 |
0.0 |
0.0 |
|
2.1 |
|
0.0 |
+/- 2% |
0.0 |
0.00 |
|
OBL 0.5% 12-Apr-19 |
May-14 |
0.0 |
0.0 |
|
5.3 |
|
0.0 |
+/- 0% |
0.0 |
0.00 |
|
BKO 0% 14-Jun-19 |
May-17 |
0.0 |
0.0 |
|
2.1 |
|
0.0 |
+/- 1% |
0.0 |
0.00 |
|
DBR 3.5% 04-Jul-19 |
May-09 |
0.0 |
0.0 |
7.9 |
0.0 |
+/- 0% |
0.0 |
0.00 |
||
|
BKO 0% 13-Sep-19 |
Aug-17 |
13.0 |
0.0 |
-0.556 |
2.2 |
0.0 |
+/- 1% |
0.0 |
0.00 |
|
|
OBL 0.25% 11-Oct-19 |
Sep-14 |
16.0 |
0.0 |
-0.611 |
5.3 |
0.0 |
+/- 0% |
0.0 |
0.00 |
|
|
BKO 0% 13-Dec-19 |
Nov-17 |
13.0 |
0.0 |
-0.638 |
2.2 |
0.0 |
+/- 1% |
0.0 |
0.00 |
|
|
DBR 3.25% 04-Jan-20 |
Nov-09 |
22.0 |
0.0 |
-0.697 |
7.3 |
0.0 |
+/- 0% |
0.0 |
0.00 |
|
|
BKO 0% 13-Mar-20 |
Feb-18 |
13.0 |
0.0 |
-0.666 |
2.3 |
0.0 |
+/- 1% |
0.0 |
0.00 |
|
|
DBRI 1.75% 15-Apr-20 |
Jun-09 |
16.0 |
0.0 |
5.3 |
0.0 |
+/- 0% |
0.0 |
0.00 |
||
|
OBL 0% 17-Apr-20 |
Jan-15 |
20.0 |
0.0 |
-0.663 |
6.6 |
0.0 |
+/- 0% |
0.0 |
0.00 |
|
|
BKO 0% 12-Jun-20 |
May-18 |
12.0 |
0.0 |
-0.692 |
1.9 |
0.0 |
+/- 2% |
0.0 |
0.00 |
|
|
DBR 3% 04-Jul-20 |
Apr-10 |
22.0 |
7.3 |
-0.705 |
7.3 |
100% |
0.0 |
+/- 0% |
0.0 |
0.00 |
|
DBR 2.25% 04-Sep-20 |
Aug-10 |
16.0 |
5.3 |
-0.707 |
5.3 |
100% |
0.0 |
+/- 0% |
0.0 |
0.00 |
|
BKO 0% 11-Sep-20 |
Aug-18 |
12.0 |
4.0 |
-0.706 |
1.2 |
30% |
2.8 |
+/- 1% |
2.8 |
0.00 |
|
OBL 0.25% 16-Oct-20 |
Jul-15 |
19.0 |
6.3 |
-0.713 |
6.3 |
100% |
0.0 |
+/- 0% |
0.0 |
0.00 |
|
BKO 0% 11-Dec-20 |
Nov-18 |
12.0 |
4.0 |
-0.723 |
0.6 |
16% |
3.3 |
+/- 3% |
3.4 |
0.01 |
|
DBR 2.5% 04-Jan-21 |
Nov-10 |
19.0 |
6.3 |
-0.782 |
6.3 |
100% |
0.0 |
+/- 0% |
0.0 |
0.00 |
|
BKO 0% 12-Mar-21 |
Feb-19 |
13.0 |
4.3 |
-0.728 |
0.2 |
5% |
4.1 |
+/- 5% |
4.1 |
0.01 |
|
OBL 0% 09-Apr-21 |
Feb-16 |
21.0 |
6.9 |
-0.732 |
6.9 |
100% |
0.0 |
+/- 0% |
0.0 |
0.00 |
|
BKO 0% 11-Jun-21 |
May-19 |
10.0 |
3.3 |
-0.736 |
0.0 |
0% |
3.3 |
+/- 49% |
3.3 |
0.00 |
|
DBR 3.25% 04-Jul-21 |
Apr-11 |
19.0 |
6.3 |
-0.733 |
6.3 |
100% |
0.0 |
+/- 0% |
0.0 |
0.00 |
|
DBR 2.25% 04-Sep-21 |
Aug-11 |
16.0 |
5.3 |
-0.737 |
5.3 |
100% |
0.0 |
+/- 0% |
0.0 |
0.00 |
|
OBL 0% 08-Oct-21 |
Jul-16 |
19.0 |
6.3 |
-0.740 |
6.3 |
100% |
0.0 |
+/- 0% |
0.0 |
0.00 |
|
DBR 2% 04-Jan-22 |
Nov-11 |
20.0 |
6.6 |
-0.745 |
6.6 |
100% |
0.0 |
+/- 0% |
0.0 |
0.00 |
|
OBL 0% 08-Apr-22 |
Feb-17 |
18.0 |
5.9 |
-0.743 |
5.9 |
100% |
0.0 |
+/- 0% |
0.0 |
0.00 |
|
DBR 1.75% 04-Jul-22 |
Apr-12 |
24.0 |
7.9 |
-0.734 |
7.9 |
100% |
0.0 |
+/- 0% |
0.0 |
0.00 |
|
DBR 1.5% 04-Sep-22 |
Sep-12 |
18.0 |
5.9 |
-0.735 |
5.9 |
100% |
0.0 |
+/- 0% |
0.0 |
0.00 |
|
OBL 0% 07-Oct-22 |
Jul-17 |
17.0 |
5.6 |
-0.728 |
4.5 |
81% |
1.1 |
+/- 1% |
1.1 |
0.00 |
|
DBR 1.5% 15-Feb-23 |
Jan-13 |
18.0 |
5.9 |
-0.713 |
5.9 |
100% |
0.0 |
+/- 0% |
0.0 |
0.00 |
|
OBL 0% 14-Apr-23 |
Feb-18 |
16.0 |
5.3 |
-0.707 |
2.8 |
53% |
2.5 |
+/- 1% |
2.6 |
0.02 |
|
DBRI 0.1% 15-Apr-23 |
Mar-12 |
16.5 |
5.4 |
|
5.3 |
97% |
0.2 |
+/- 0% |
0.2 |
0.00 |
|
DBR 1.5% 15-May-23 |
May-13 |
18.0 |
5.9 |
-0.697 |
5.9 |
100% |
0.0 |
+/- 0% |
0.0 |
0.00 |
|
DBR 2% 15-Aug-23 |
Sep-13 |
18.0 |
5.9 |
-0.686 |
5.9 |
100% |
0.0 |
+/- 0% |
0.0 |
0.00 |
|
OBL 0% 13-Oct-23 |
Jul-18 |
16.0 |
5.3 |
-0.676 |
1.2 |
23% |
4.1 |
+/- 3% |
4.2 |
0.00 |
|
DBR 6.25% 04-Jan-24 |
Jan-94 |
10.3 |
3.4 |
-0.654 |
3.4 |
100% |
0.0 |
+/- 0% |
0.0 |
0.00 |
|
DBR 1.75% 15-Feb-24 |
Jan-14 |
18.0 |
5.9 |
-0.652 |
5.9 |
100% |
0.0 |
+/- 0% |
0.0 |
0.00 |
|
OBL 0% 05-Apr-24 |
Jan-19 |
21.0 |
6.9 |
-0.631 |
0.2 |
3% |
6.8 |
+/- 6% |
7.0 |
0.01 |
|
DBR 1.5% 15-May-24 |
May-14 |
18.0 |
5.9 |
-0.639 |
5.9 |
100% |
0.0 |
+/- 0% |
0.0 |
0.00 |
|
DBR 1% 15-Aug-24 |
Sep-14 |
18.0 |
5.9 |
-0.619 |
5.9 |
100% |
0.0 |
+/- 0% |
0.0 |
0.00 |
|
DBR 0.5% 15-Feb-25 |
Jan-15 |
23.0 |
7.6 |
-0.590 |
7.6 |
100% |
0.0 |
+/- 0% |
0.0 |
0.00 |
|
DBR 1% 15-Aug-25 |
Jul-15 |
23.0 |
7.6 |
-0.562 |
7.6 |
100% |
0.0 |
+/- 0% |
0.0 |
0.00 |
|
DBR 0.5% 15-Feb-26 |
Jan-16 |
26.0 |
8.6 |
-0.525 |
8.6 |
100% |
0.0 |
+/- 0% |
0.0 |
0.00 |
|
DBRI 0.1% 15-Apr-26 |
Mar-15 |
16.3 |
5.4 |
|
5.2 |
96% |
0.2 |
+/- 0% |
0.3 |
0.00 |
|
DBR 0% 15-Aug-26 |
Jul-16 |
25.0 |
8.3 |
-0.493 |
8.3 |
100% |
0.0 |
+/- 0% |
0.0 |
0.00 |
|
DBR 0.25% 15-Feb-27 |
Jan-17 |
26.0 |
8.6 |
-0.454 |
8.2 |
95% |
0.4 |
+/- 1% |
0.4 |
0.00 |
|
DBR 6.5% 04-Jul-27 |
Jul-97 |
11.2 |
3.7 |
-0.430 |
3.7 |
100% |
0.0 |
+/- 0% |
0.0 |
0.00 |
|
DBR 0.5% 15-Aug-27 |
Jul-17 |
25.0 |
8.3 |
-0.418 |
5.7 |
69% |
2.5 |
+/- 1% |
2.7 |
0.00 |
|
DBR 5.625% 04-Jan-28 |
Jan-98 |
14.5 |
4.8 |
-0.408 |
4.8 |
100% |
0.0 |
+/- 0% |
0.0 |
0.00 |
|
DBR 0.5% 15-Feb-28 |
Jan-18 |
21.0 |
6.9 |
-0.375 |
3.2 |
46% |
3.8 |
+/- 1% |
4.1 |
0.04 |
|
DBR 4.75% 04-Jul-28 |
Oct-98 |
11.3 |
3.7 |
-0.373 |
3.7 |
100% |
0.0 |
+/- 0% |
0.0 |
0.00 |
|
DBR 0.25% 15-Aug-28 |
Jul-18 |
21.0 |
6.9 |
-0.327 |
1.3 |
19% |
5.6 |
+/- 4% |
5.9 |
0.01 |
|
DBR 0.25% 15-Feb-29 |
Jan-19 |
22.0 |
7.3 |
-0.280 |
0.2 |
3% |
7.1 |
+/- 5% |
7.4 |
0.01 |
|
DBR 6.25% 04-Jan-30 |
Jan-00 |
9.3 |
3.1 |
-0.294 |
3.1 |
100% |
0.0 |
+/- 0% |
0.0 |
0.00 |
|
DBRI 0.5% 15-Apr-30 |
Apr-14 |
14.1 |
4.6 |
|
4.2 |
91% |
0.4 |
+/- 0% |
0.5 |
0.00 |
|
DBR 5.5% 04-Jan-31 |
Oct-00 |
17.0 |
5.6 |
-0.239 |
5.6 |
100% |
0.0 |
+/- 0% |
0.0 |
0.00 |
|
DBR 4.75% 04-Jul-34 |
Jan-03 |
20.0 |
6.6 |
-0.059 |
6.6 |
100% |
0.0 |
+/- 0% |
0.0 |
0.00 |
|
DBR 4% 04-Jan-37 |
Jan-05 |
23.0 |
7.6 |
0.044 |
7.6 |
100% |
0.0 |
+/- 0% |
0.0 |
0.00 |
|
DBR 4.25% 04-Jul-39 |
Jan-07 |
14.0 |
4.6 |
0.124 |
4.6 |
100% |
0.0 |
+/- 0% |
0.0 |
0.00 |
|
DBR 4.75% 04-Jul-40 |
Jul-08 |
16.0 |
5.3 |
0.138 |
5.3 |
100% |
0.0 |
+/- 0% |
0.0 |
0.00 |
|
DBR 3.25% 04-Jul-42 |
Jul-10 |
15.0 |
5.0 |
0.205 |
5.0 |
100% |
0.0 |
+/- 0% |
0.0 |
0.00 |
|
DBR 2.5% 04-Jul-44 |
Apr-12 |
27.5 |
9.1 |
0.272 |
9.0 |
99% |
0.1 |
+/- 0% |
0.1 |
0.04 |
|
DBRI 0.1% 15-Apr-46 |
Jun-15 |
8.4 |
2.8 |
|
2.2 |
81% |
0.5 |
+/- 2% |
0.7 |
0.04 |
|
DBR 2.5% 15-Aug-46 |
Feb-14 |
28.0 |
9.2 |
0.310 |
8.7 |
94% |
0.6 |
+/- 1% |
0.9 |
0.03 |
|
DBR 1.25% 15-Aug-48 |
Sep-17 |
15.5 |
5.1 |
0.346 |
1.5 |
29% |
3.6 |
+/- 2% |
4.6 |
0.07 |
|
Italic = index-linked |
Total |
56.3 |
0.3 |
|||||||
|
Yield below Depo Rate |
||||||||||
|
Yield above Depo Rate |
Bund WAM |
16.1 |
There is a LOT more detail in all this analysis, so I’m more than happy to discuss!
Best wishes,
David
David Sansom
![]() image001.jpg@01D21F13.B69A4950">
image001.jpg@01D21F13.B69A4950">
UK: 14-16 Dowgate Hill, London EC4R 2SU
US: 245 Park Ave, 39th Floor, NY, NY, 10167
Office: +44 (0) 203 143 4180
Mobile: +44 (0) 7976 204490
Email: david.sansom@astorridge.com
Web: www.AstorRidge.com
This marketing was prepared by David Sansom, a consultant with Astor Ridge. It is not appropriate to characterize this e-mail as independent investment research as referred to in MiFID and that it should be treated as a marketing communication even if it contains a trade recommendation. A history of marketing materials and research reports can be provided upon request in compliance with the European Commission’s Market Abuse Regulation. Astor Ridge takes no proprietary trading risk, has no market making facilities, and has no position in any security we discuss in this e-mail. The views in this e-mail are those of the author(s) and are subject to change, and Astor Ridge has no obligation to update its opinions or the information in this publication. If this e-mail contains opinions or recommendations, those opinions or recommendations reflect solely and exclusively those of the author, and such opinions were prepared independently of any other interests, including those of Astor Ridge and/or its affiliates. This publication does not constitute personal investment advice or take into account the individual financial circumstances or objectives of the those who receive it. The securities discussed herein may not be suitable for all investors. Astor Ridge recommends that investors independently evaluate each issuer, security or instrument discussed herein, and consult any independent advisors they believe necessary. The value of, and income from, any investment may fluctuate from day to day as a result of changes in relevant economic markets (including changes in market liquidity). The information herein is not intended to predict actual results, which may differ substantially from those reflected. Past performance is not necessarily indicative of future results.
You should not use or disclose to any other person the contents of this e-mail or its attachments (if any), nor take copies. This e-mail is not a representation or warranty and is not intended nor should it be taken to create any legal relations, contractual or otherwise. This e-mail and any files transmitted with it are confidential, may be legally privileged, and are for the sole use of the intended recipient. Copyright in this e-mail and any accompanying document created by Astor Ridge LLP is owned by Astor Ridge LLP.
Astor Ridge LLP is regulated by the Financial Conduct Authority (FCA): Registration Number 579287
Astor Ridge LLP is Registered in England and Wales with Companies House: Registration Number OC372185
Astor Ridge NA LLP is a member of FINRA/SIPC: CRD Number 282626
Astor Ridge NA LLP is Registered in England and Wales with Companies House: Registration Number OC401796
Swap curve RV: USD 1y2y/5y2y is too steep compared to 3y2y
Bottom line: A straightforward swap RV trade in USD, where the forward curve of 2y rates looks too steep for the level of rates. The dislocations have been short-lived historically, so this is a tactical trade: though pleasingly the hedged flattener has positive curve rolldown.
Trade:
Pay USD 525mm 1y2y swap
Receive USD 572mm 5y2y swap
Receive USD 165mm 3y2y swap
Bloomi CIX: 100 * (USFS052 Curncy - USFS012 Curncy + 0.3 * USFS032 Curncy)
Entry at 103bp, target 97bp
3m rolldown index at 97.3bp
Residual of the swap package:
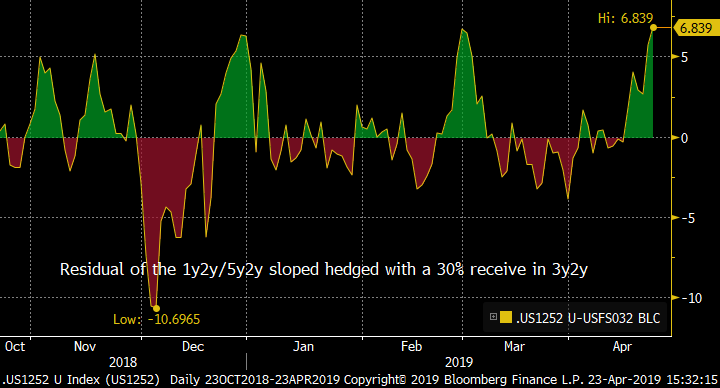
Rationale: I have been running a screener for some time now on USD, EUR and GBP forward swap curves to detect short-term dislocations on curve directionality. I scan the surface in each currency for segments where the slope is out of line with the level of rates, using an intermediate forward rate as the hedge. Given the regime shift in the US in November last year, this screening process has not been yielding much fruit for USD, as the curve directionality has been unsteady. As the market settles into the new mode of reduced Fed activity, the filter is starting to detect some short term anomalies.
The screening is based on three criteria:
- The regression statistic of the curve segment vs rate (R*2): 90% or better
- The residual (in bp) of the regression: at least +/- 5bp
- The number of standard deviations from the average: at least 2.0 standard deviations
Further to these, I also monitor the historical highs and lows of the residual and the final ‘nice-to-have’ which is the rolldown of the trade (though most of the residuals are rapidly mean-reverting so roll is less of an issue).
The filter is highlighting the 1y2y vs 5y2y curve segment, using the intermediate 3y2y rate as the hedge. Using the past 6m of history, the hedge ratio is 30% of the 3y2y (in DV01 terms).
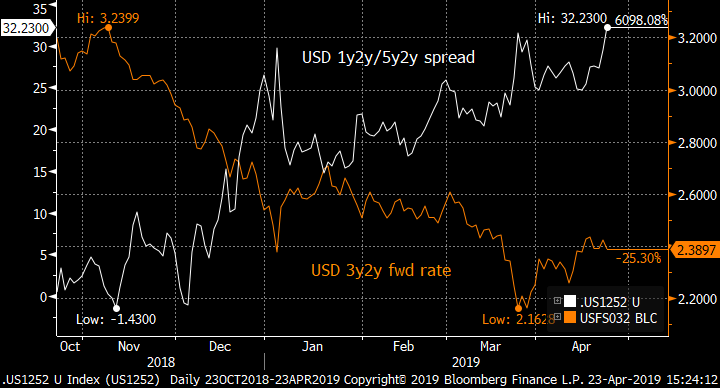
The relationship is easier to see when the 3y2y rate is inverted: the 1y2y/5y2y curve has moved out of line with the level of rates:
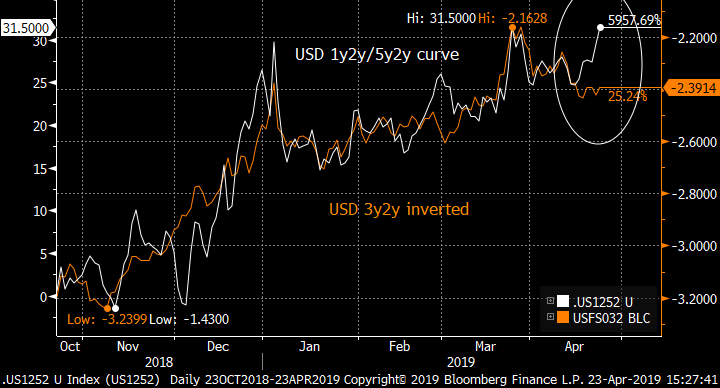
This is the regression between the 1y2y/5y2y slope (y-axis) and the 3y2y rate (x-axis). Again the curve appears too steep given the level of rates by around 6bp.
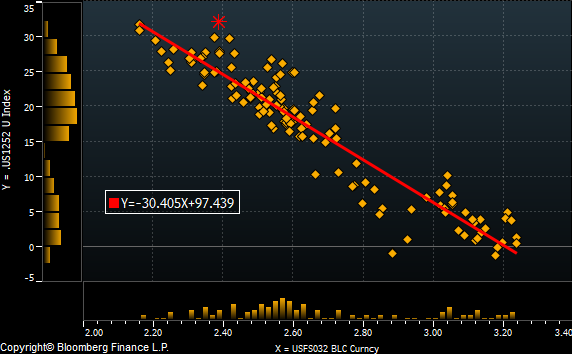
Thus we can create a hedged package of a 1y2y/5y2y flattener combined with an additional long (receive) in 3y2y with a weighting of 30%. The next chart has the residual, which shows good mean reversion and is currently at an extreme, matching the two previous highs. On the 6 month history, this signal is 2.1 standard deviations from the mean.
One final kicker is the curve rolldown. On the given hedge weighting, this trade rolls positively by just under 6bp over the first 3 months.
The main risk to this trade (as to all RV trades) is that history is not a guide to the future, and the curve regime changes. This is intended as a tactical trade on a short-term dislocation with other market conditions remaining stable. Should Fed expectations change markedly then the regression on which the weights are based will break down (either in the trade’s favour or against).
As always, your feedback is appreciated!
Best wishes
David
David Sansom
![]() image001.jpg@01D21F13.B69A4950">
image001.jpg@01D21F13.B69A4950">
UK: 14-16 Dowgate Hill, London EC4R 2SU
US: 245 Park Ave, 39th Floor, NY, NY, 10167
Office: +44 (0) 203 143 4180
Mobile: +44 (0) 7976 204490
Email: david.sansom@astorridge.com
Web: www.AstorRidge.com
This marketing was prepared by David Sansom, a consultant with Astor Ridge. It is not appropriate to characterize this e-mail as independent investment research as referred to in MiFID and that it should be treated as a marketing communication even if it contains a trade recommendation. A history of marketing materials and research reports can be provided upon request in compliance with the European Commission’s Market Abuse Regulation. Astor Ridge takes no proprietary trading risk, has no market making facilities, and has no position in any security we discuss in this e-mail. The views in this e-mail are those of the author(s) and are subject to change, and Astor Ridge has no obligation to update its opinions or the information in this publication. If this e-mail contains opinions or recommendations, those opinions or recommendations reflect solely and exclusively those of the author, and such opinions were prepared independently of any other interests, including those of Astor Ridge and/or its affiliates. This publication does not constitute personal investment advice or take into account the individual financial circumstances or objectives of the those who receive it. The securities discussed herein may not be suitable for all investors. Astor Ridge recommends that investors independently evaluate each issuer, security or instrument discussed herein, and consult any independent advisors they believe necessary. The value of, and income from, any investment may fluctuate from day to day as a result of changes in relevant economic markets (including changes in market liquidity). The information herein is not intended to predict actual results, which may differ substantially from those reflected. Past performance is not necessarily indicative of future results.
You should not use or disclose to any other person the contents of this e-mail or its attachments (if any), nor take copies. This e-mail is not a representation or warranty and is not intended nor should it be taken to create any legal relations, contractual or otherwise. This e-mail and any files transmitted with it are confidential, may be legally privileged, and are for the sole use of the intended recipient. Copyright in this e-mail and any accompanying document created by Astor Ridge LLP is owned by Astor Ridge LLP.
Astor Ridge LLP is regulated by the Financial Conduct Authority (FCA): Registration Number 579287
Astor Ridge LLP is Registered in England and Wales with Companies House: Registration Number OC372185
Astor Ridge NA LLP is a member of FINRA/SIPC: CRD Number 282626
Astor Ridge NA LLP is Registered in England and Wales with Companies House: Registration Number OC401796